Crime Mapping: How to Use Data to Choose a Safe Neighborhood
Choosing a safe neighborhood is a deeply personal decision when moving. You want to picture your daily life: walking to your car at night, letting your kids play outside, and sensing whether the block feels calm.
That confidence comes from understanding how to read the data behind safety statistics. Crime mapping offers a visual way to see patterns across neighborhoods before you visit.
Instead of relying on a street name or a neighbor’s opinion, you can view reported incidents by location, time, and type. This shift from guesswork to evidence is especially helpful when comparing multiple areas.
This guide explains how crime maps work, what their data can and cannot show, and how to use them alongside other neighborhood factors.
Key Takeaways
- Crime maps display patterns by location and incident type, offering more insight than a single citywide average.
- Data collection methods and categories affect what you see, so understanding map limitations matters.
- Safety is just one factor; combining it with schools, commute, and budget gives a clearer picture of neighborhood fit.
What Crime Maps Can Tell You Right Away
A crime map shows you where incidents have been reported and how often they occur in a specific area. Instead of just reading a summary statistic, you see whether incidents are scattered or clustered, which changes how you interpret safety.
How a Crime Map Shows Patterns by Area
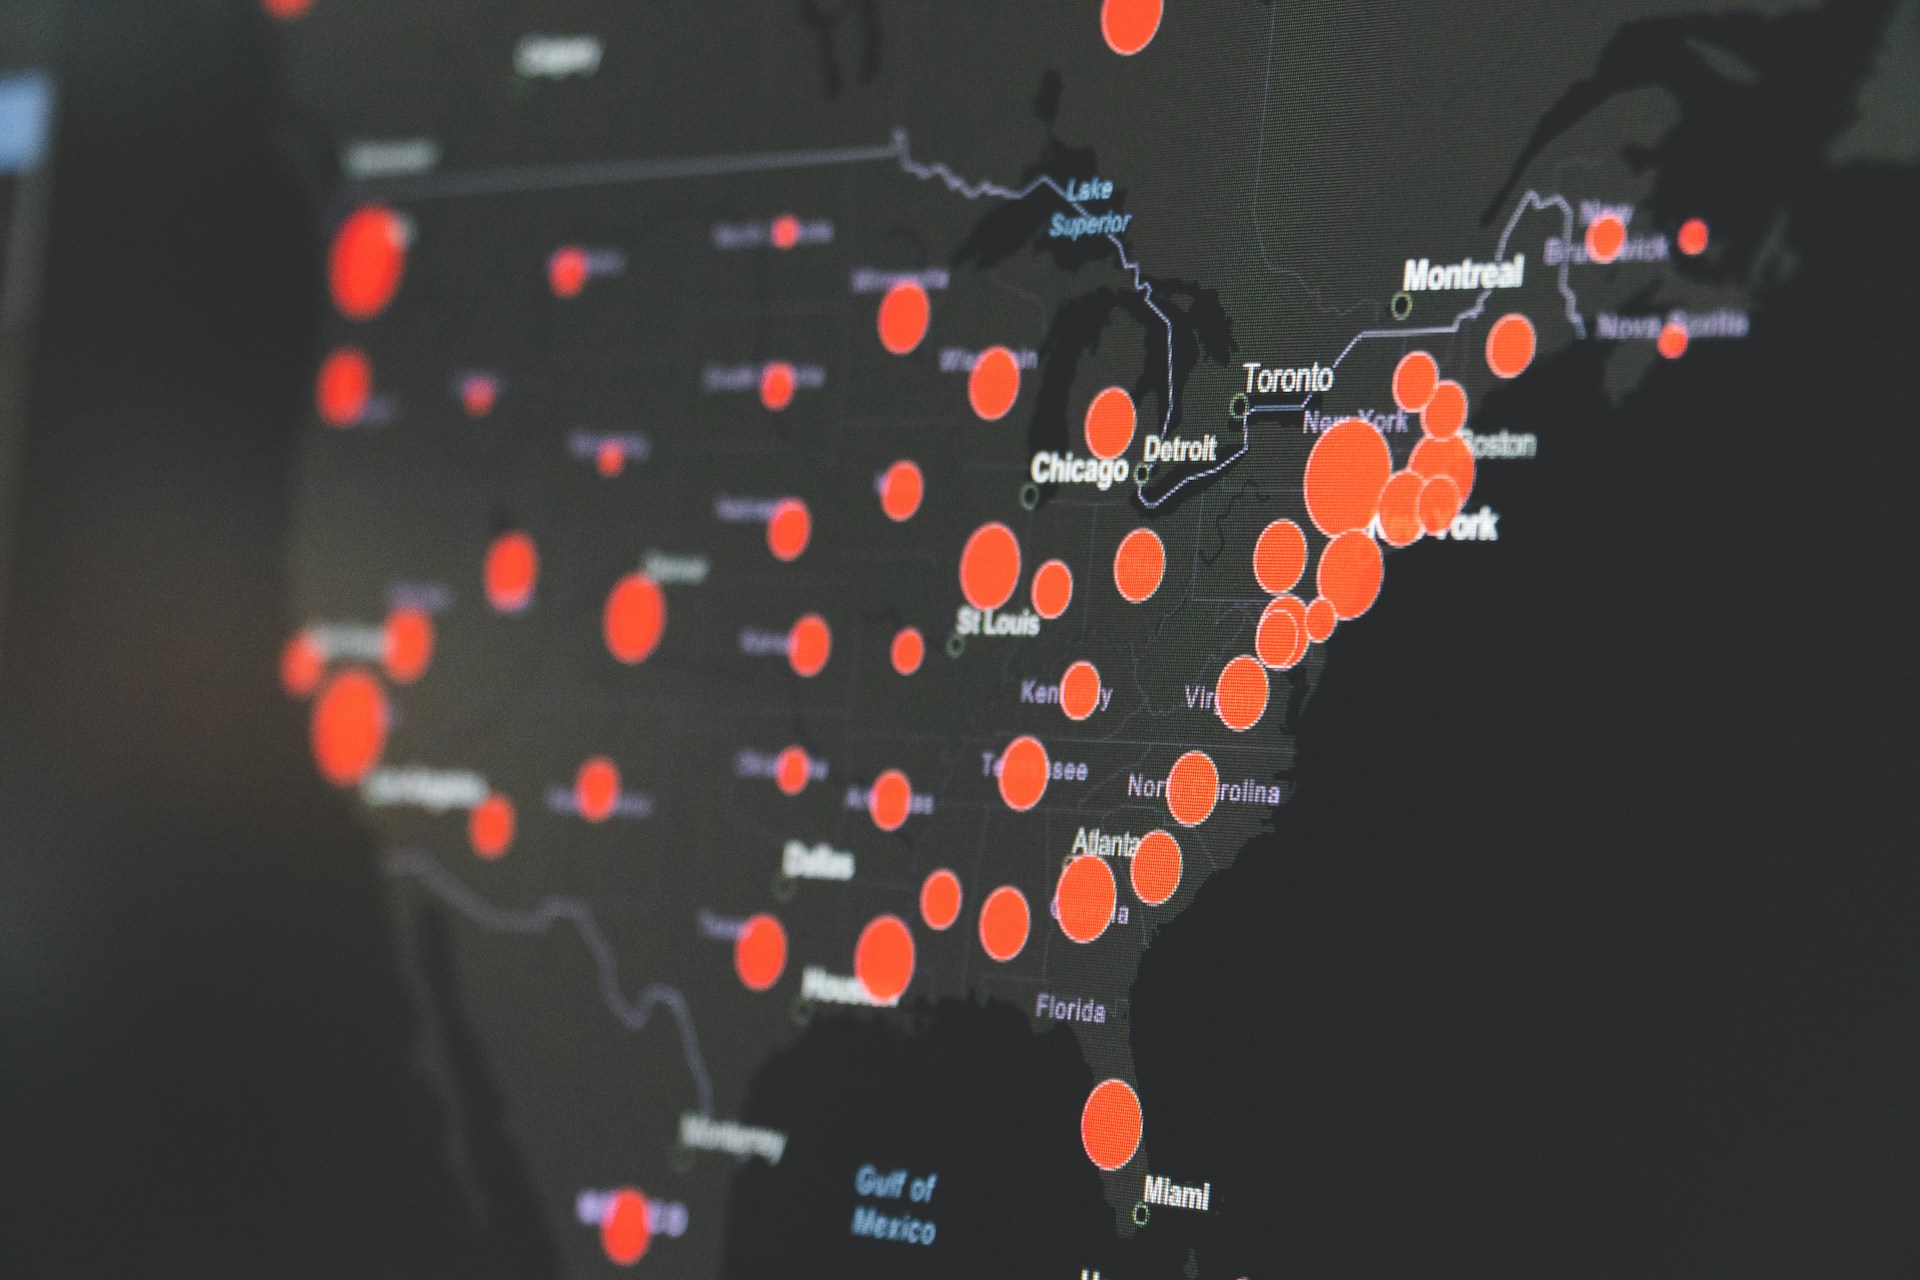
On a city crime map, you’ll see dots, heat zones, or color-coded clusters marking reported incidents. Dense clusters signal higher activity in that zone, while sparse areas suggest fewer reports.
This pattern view helps when comparing two neighborhoods side by side. A neighborhood with a higher incident count spread over a large area may feel safer than a smaller area with a concentrated cluster near a busy street.
Why Recent Incidents Matter More Than Citywide Averages
A citywide crime average blends active and quiet areas into one number, which can be misleading. Recent, location-specific data is more actionable.
For example, if you see a spike in vehicle thefts over the last 90 days near a parking area, that’s something to factor in. Older data might reflect conditions that have changed, especially in transitioning neighborhoods.
For buyers in cities like Philadelphia, looking at safest neighborhoods in Philadelphia by area is more honest than relying on a city average.
How Crime Data Is Collected and Displayed
Knowing where the numbers come from helps you trust a crime map. Not all maps use the same sources, and gaps in reporting can affect what you see.
Where Reported Incidents Usually Come From
Most public crime data comes from local law enforcement agencies submitting reports to state databases or the FBI’s Uniform Crime Reporting program. These reports are organized by incident type, location, and date.
Some national crime data platforms collect reports from agencies across the U.S. and Canada, assigning incidents to specific cities and neighborhoods for standardized comparisons.
Why Categories and Update Timing Can Vary
Crime categories can vary by agency. One department might log an incident as assault, while another uses a different label.
Update frequency also differs. Some maps refresh daily, others monthly, or use data that’s several months old. Knowing how current the data is helps you weigh it correctly.
If the update window is unclear, treat the map as a trend indicator rather than a live feed.
Which Incident Types Should Shape Your Research
Not all crime categories carry the same weight when choosing where to live. The type of incident matters as much as the frequency.
How Violent and Property Crime Affect Daily Life
Violent crime: assault, robbery, homicide — has a strong effect on how safe a neighborhood feels. In standardized neighborhood safety scoring, assault and robbery rates together typically account for the largest share of a location’s safety grade, reflecting their direct impact on residents’ daily sense of security.
Property crime: burglary, vehicle theft, larceny — affects daily routines in other ways. High vehicle theft rates can disrupt your commute and sense of security.
For families comparing areas like the safest neighborhoods in Baltimore or safest neighborhoods in Atlanta, knowing which type of crime is driving higher scores helps you assess risk.
When to Look Closer at Arson, Robbery, and Theft
Arson, robbery, and theft each signal different risks. Clusters of arson in a small area can indicate instability or disputes.
Robbery involves theft with force, making it a key indicator of street-level safety. High robbery rates near transit stops or retail corridors can affect your comfort running errands or commuting.
Theft, especially auto theft and larceny, is often more opportunistic but deserves attention if concentrated near residential areas.
How to Compare Neighborhoods Without Misreading the Data
Crime data is most useful in context. Raw incident counts can mislead as easily as they can inform.
Why Boundaries, Density, and Time Range Matter
Two neighborhoods with similar incident counts can differ greatly when you factor in size and population. A dense urban area with 50,000 residents and 200 incidents has a lower rate per capita than a small suburb with the same count.
Boundary definitions matter. Some maps use census tracts, others zip codes, or police district lines. A map covering a large area may include incidents far from your target home.
Zooming in and understanding the map’s geographic unit helps you avoid wrong conclusions.
| Comparison Factor | Why It Matters |
|---|---|
| Incidents per capita | Adjusts for neighborhood size and population density |
| Geographic boundary | Defines which blocks and streets are actually included |
| Time range | Indicates whether trends are recent or historical |
| Incident type | Distinguishes violent crime from property crime |
| Reporting completeness | Reflects whether the local agency submits full data |
How to Balance Safety With Schools, Commute, and Budget
Safety is just one part of choosing a neighborhood. A block that scores well on crime data might have limited school options, a long commute, or high housing costs.
A practical approach is to set a minimum safety threshold, then compare neighborhoods that meet it across your other priorities. For families, school quality often matters as much as crime rates.
Comparing best schools in Miami or best schools in Atlanta alongside safety data helps families see where everything aligns.
How to Use Alerts and Ongoing Tracking Before You Move
A single look at a crime map gives you a snapshot. Tracking a neighborhood over several weeks gives you a sense of whether conditions are stable, improving, or changing.
When Personalized Alerts Can Help You Monitor Change
Many crime tracking platforms offer personalized alerts for a specific address or area. Once set up, you receive notifications when new incidents are reported nearby.
This is especially useful between your research phase and your move-in date. If you receive multiple alerts in a short window, it’s worth investigating further.
A single incident near a commercial area is different from several incidents on the same residential block over two weeks. Alerts help you spot those patterns without checking the map daily.
What to Watch for During Your Shortlist Phase
When you’ve narrowed your search to a few neighborhoods, monitoring for a few weeks can reveal trends a static map would miss. Pay attention to time of day, specific streets, and whether incidents cluster near certain locations.
A neighborhood with minimal new activity over 30 days signals baseline stability. Consistency matters when making a long-term decision, especially if you can’t visit in person.
- Watch for incident clusters near your target streets
- Note if incidents happen during daytime, evenings, or overnight
- Track whether activity is near residential or commercial areas
- Compare monitored neighborhoods over the same time window
- Flag unusual spikes and cross-reference with local news if possible
Turning Safety Research Into a Confident Move Decision
Eventually, you’ll move from research to decision. Crime data is a tool for clarity.
Questions to Ask Before You Rule a Neighborhood In or Out
Before dismissing a neighborhood based on crime data, ask if the incident rate per capita is truly higher than similar areas, or if it just appears so due to raw count. Are incidents near your target streets, or spread across a wider area? Is the data recent?
Before assuming a low-crime rating means a perfect fit, consider if the map includes complete reporting. Some areas have lower counts because of underreporting, not absence of crime. Stay curious and avoid relying on a single score.
When a Personalized Neighborhood Comparison Tool Can Help
A personalized neighborhood comparison lets you weigh safety alongside schools, commute, affordability, and community fit. SettleSavvy offers this kind of layered comparison for free, scoring neighborhoods on what matters most to you.
If you want guidance on weighing safety with your priorities, you can book a free relocation consultation with a Savvy Consultant.
Frequently Asked Questions
How Can You Check the Safety of a Neighborhood Using a Map Before You Sign a Lease or Buy a Home?
You can use publicly available crime mapping tools to view reported incidents by location, type, and date for any area you are considering. Focus on incident density near specific streets and blocks, not just the broader ZIP code. Combining this with resident data and rate-per-capita comparisons gives you a more reliable read than a single safety score.
What Should You Look for When You Compare Crime Trends Across Neighborhoods, Not Just One-Time Incidents?
Look for whether incident counts are rising, falling, or stable over a 30 to 90-day window. Clusters of the same incident type in a short timeframe are more meaningful than scattered reports over a long period. Time-of-day patterns and proximity to locations like transit stops or commercial corridors also help distinguish routine background noise from genuine trends.
How Do You Search Crime Reports by Address, and What Details Matter Most for Day-to-Day Peace of Mind?
Most crime platforms let you enter an address and view a radius of reported incidents. The most relevant details for daily life are incident type (violent versus property), frequency near your specific address, and recency.
A vehicle theft two blocks away last week matters more than an assault reported across the district six months ago.
Where Can You Find a Free Map of Recent Police Activity, and How Often Is It Usually Updated?
Many city police departments publish public crime dashboards that are updated weekly or monthly. Third-party platforms aggregate those reports and display them in a visual format, though update frequency varies by platform and jurisdiction.
Always check the data timestamp before drawing conclusions, since some maps reflect incidents from the prior quarter rather than the current week.
How Can You Use SettleSavvy’s Neighborhood Scoring to Balance Safety With Schools, Commute, and Housing Costs?
SettleSavvy’s personalized neighborhood scoring tool lets you choose which factors matter most to your household and scores neighborhoods against all of them at once, including crime, education, commute, and affordability. That side-by-side view helps you find neighborhoods where safety and your other priorities align.
How Do You Know When You Have Done Enough Crime Research to Make a Confident Decision?
When you have looked at incident type, rate per capita, and trend over at least 30 days for your specific target streets, and cross-referenced that with a visit or local input, you have enough to make a grounded call. The goal is not to eliminate all uncertainty but to replace guesswork with a clear, honest picture of what the data actually shows.
Making Crime Data Work for Your Move
Safety research is most useful when it helps you move forward. The goal is to reach a clear, honest picture of which neighborhoods meet your threshold for safety and then compare the rest of your priorities from there.
Crime mapping gives you the geographic and temporal detail to do that well. When you read maps at the right scale, track trends over time, and interpret incident types in the context of your daily life, the data becomes actionable.To bring all of that together, build your free neighborhood map on SettleSavvy. Score neighborhoods across safety, schools, commute, and more in minutes before making your final call.