Texas Household Income Percentiles: 2026 Breakdown
Ever wondered exactly where your family’s income stacks up against other Texas households? In a state as vast and diverse as Texas, with booming cities like Austin and Houston driving economic growth, understanding your position on the income ladder can transform how you plan your finances, set goals, and make informed choices.
This in-depth analysis of household income percentile Texas for 2026 delivers clear, projected breakdowns tailored for beginners. We define what percentiles truly mean, from the bottom 10% scraping by on modest earnings to the top 1% enjoying seven-figure households. You will discover precise income thresholds for every percentile, regional differences across urban and rural areas, and key factors like job markets and cost of living influencing these ranks.
By the end, you will know how to locate your own household’s percentile, benchmark against Texas averages, and gain actionable insights for budgeting, investing, or career moves. Armed with this authoritative data, step confidently into Texas’s dynamic economy.
Texas Household Income Overview
Household income percentiles offer a clear way to understand where your earnings rank within Texas’s population of about 11 million households. The median, or 50th percentile, marks the midpoint where half of households earn more and half earn less; for instance, Texas’s median stands at $79,721 to $80,800 based on 2024 data. Higher percentiles, like the 75th at $141,300 to $152,118, show the threshold for the top 25% of earners. For cross-state movers, these rankings matter deeply when evaluating affordability, as they reveal relative purchasing power amid Texas’s no state income tax advantage and varying local costs. A family earning $100,000 might rank in the 60th national percentile but slip to around the 55th in Texas, affecting housing budgets in metros like Austin or Dallas. Tools like percentile calculators help movers compare their income rank from origin states to Texas, simplifying decisions on neighborhoods that match their financial profile.
Recent 2026 projections, drawn from the 2024 American Community Survey (ACS) and analyses, confirm Texas median household income at $79,721-$80,800, trailing the U.S. figure of $83,592 by 2-3%. The average household income ranges from $109,933 to $119,321, similarly below national levels due to fewer ultra-high earners. Texas’s Gini index of 0.479 reflects stable income inequality, slightly lower than the U.S. 0.481 and consistent over recent years, indicating a broad middle class without widening gaps. Metro variations add nuance: Austin at $99,900 (slight dip), Dallas-Fort Worth at $92,700 (up 3.7%), Houston at $81,400 (stable), and San Antonio at $78,100 (up 3.7%). These figures, sourced from DQYDJ’s state income data and USAFacts Texas profile, underscore modest growth of 2.2% year-over-year into 2026.
Texas’s income distribution peaks in the middle, with about 5% of households under $10,000, 13% in the $75,000-$100,000 range, and 12% above $200,000. This contrasts with national averages, where Texas shows more households in $50,000-$100,000 brackets but fewer in the top tiers beyond $200,000. The 25th percentile at $40,000-$42,656 exceeds the U.S. equivalent, while the top 1% threshold of $645,000-$660,000 lags slightly. Per Census ACS data, this middle-heavy skew supports family-friendly suburbs yet highlights risks for lower earners.
Cross-state movers rely on these percentiles to sidestep lifestyle mismatches, such as feeling financially stretched in high-cost areas despite solid earnings. For example, a $120,000 household ranks in Texas’s top 30-35%, enabling access to affluent neighborhoods like those in Frisco or Plano with strong schools and amenities. By aligning with peer income levels, movers reduce stress, build community ties, and maximize Texas’s 8% below-average cost of living. This data-driven approach streamlines the relocation process, guiding selections that fit budgets and aspirations long-term.
Detailed Income Percentile Table for Texas
Texas household income percentiles reveal a distribution that favors mid-range earners, making it particularly appealing for cross-state movers seeking value. Building on the state’s median of around $78,600 to $80,800, the 25th percentile falls between $40,000 and $42,656, which positions it slightly above some U.S. benchmarks near $41,000 and signals stronger entry-level opportunities compared to higher-cost regions. At the 75th percentile, incomes range from $141,300 to $152,118, aligning closely with the national figure around $153,000 and reflecting solid upper-middle prospects. The top 1% threshold, at $645,000 to $660,000, trails the U.S. peak near $659,000, underscoring Texas’s more accessible wealth ladder despite fewer ultra-high earners. This structure, with a Gini index of about 0.479, shows stable inequality and a peak concentration in the $75,000 to $100,000 bracket for 13% of households.
For quick reference, the table below details key household income percentiles based on 2024 American Community Survey data for Texas’s roughly 11 million households. It compares Texas directly to U.S. averages, highlighting where movers’ earnings stack up.
| Percentile | Texas Household Income (2024) | U.S. Household Income (2024) | Notes |
|---|---|---|---|
| 10th | $20,000 | $19,889 | Entry-level similar |
| 25th | $40,000 | $41,401 | Texas competitive for beginners |
| 50th (Median) | $78,600 | $83,592 | TX 2-3% below national |
| 75th | $141,300 | $153,000 | Upper-middle aligned |
| 99th (Top 1%) | $660,000 | $659,000 | Energy/tech driven |
Source: DQYDJ 2024 Income by State, DQYDJ Household Income Percentiles.
Projections to 2026 anticipate modest 2-3% annual growth, driven by metro gains in Dallas-Fort Worth ($92,700 median) and San Antonio ($78,100), offsetting flats in Houston ($81,400) and Austin ($99,900). Here’s a projected snapshot:
| Percentile | 2024 Actual | 2026 Projected |
|---|---|---|
| 25th | $40,000 | $42,000 |
| 50th | $78,600 | $82,500 |
| 75th | $141,300 | $148,500 |
| 99th | $660,000 | $693,000 |
These forecasts account for in-migration boosting tech sectors, per Dallas Fed indicators.
A $100,000 household income ranks in the top 40-50% statewide, between the median and 75th percentile, ideal for upper-middle suburbs like Plano, Frisco, or Sugar Land where median homes cost $400,000 to $600,000. This positioning supports family amenities, better schools, and avoids lifestyle inflation in core cities. For example, in Dallas-Fort Worth, it affords a 4-bedroom home with room for savings, unlike pricier coastal metros.
To pinpoint your exact household income percentile in Texas, use tools like SettleSavvy.ai. Simply input your gross income for an instant percentile plus tailored neighborhood matches that factor in affordability and lifestyle fit, streamlining your move.
Compared to the U.S., Texas offers 8-10% lower cost of living (index 92 vs. 100), with housing 19% cheaper and no state income tax adding 5-7% purchasing power. A $100,000 income stretches like $115,000 nationally, easing transitions for movers eyeing Austin tech hubs or Houston energy corridors. This edge, amid stable trends, positions Texas as a smart relocation choice.
Income Percentiles by Major Texas Metros
Austin Metro: Tech Hub with High-Earning Potential
The Austin-Round Rock-San Marcos metro area leads Texas metros in median household income at $99,897, according to the latest 2024 American Community Survey (ACS) data from the U.S. Census Bureau 2024 ACS Metro Income Brief. This figure represents a slight 1.5% dip from 2023’s $101,402, attributed to tech sector layoffs and a cooling in migration momentum after years of explosive growth. Despite the dip, Austin remains tech-driven, with high earners in software, semiconductors, and corporate relocations pushing the top 10% household income percentile above $220,000 and the top 5% nearing $350,000. For cross-state movers, this distribution signals neighborhoods like Westlake or Barton Creek, where median incomes exceed $200,000, offering premium amenities and schools without the ultra-competitive urban core. Beginners assessing their household income percentile in Texas should note that even a modest six-figure salary places you solidly in the upper half here, easing lifestyle fit. Use tools like Census QuickFacts to map your income against local ZIP codes for precise neighborhood matches.
Dallas-Fort Worth Metro: Robust Growth in Family-Oriented Suburbs
Dallas-Fort Worth-Arlington boasts a median household income of $92,733, up 3.7% year-over-year from $89,411, reflecting strong corporate influx and suburban expansion. Family suburbs like Southlake stand out, with median household incomes over $250,000 and averages around $384,000, ranking among the nation’s wealthiest communities. This growth positions the metro’s 75th percentile around $150,000, ideal for movers in the top Texas household income quartile seeking top-rated schools and low crime. Affluent areas such as Highland Park and University Park similarly exceed $250,000 medians, creating pockets where upper-middle earners thrive without stretching budgets. For those relocating, DFW’s upward trajectory means your current income likely buys more stability here than in pricier metros, simplifying neighborhood selection around lifestyle priorities like commute times and family amenities.
Houston Metro: Stable with Affluent Urban Pockets
Houston’s metro median holds steady at $81,417, essentially flat with a negligible 0.5% decline that falls within survey margins of error. Yet, ZIP code 77010 in downtown and Midtown shines with a $189,000 median household income and $404,000 average, more than double the metro norm, fueled by energy, finance, and medical professionals. This creates a top 10% threshold near $190,000, highlighting inequality where affluent enclaves coexist with broader middle-class ranges. Movers benefit by targeting such areas for upscale living aligned with their earnings percentile, avoiding overextension in outer suburbs. Stable energy sectors ensure predictable growth, making Houston a low-risk choice for value-conscious families.
San Antonio Metro: Affordable Growth Leader
San Antonio-New Braunfels surged to $78,112 median household income, a solid 3.7% gain from $75,345, marking one of the fastest rises among large U.S. metros. Its affordability shines, with middle-class spans from $41,500 to $124,600 and top 10% around $170,000, lower inequality than Austin. Suburbs like Alamo Heights approach $150,000 medians, blending growth with accessibility. This appeals to movers seeking upward mobility without premium costs.
Comparing Metros: Visual Insights for Neighborhood Selection
Visualize a bar chart from ACS data: Austin’s blue bar peaks at $99.9k, DFW green at $92.7k, Houston orange and San Antonio red cluster near $80k, against the U.S. dashed $81.6k line Every Texan Census Analysis. Interactive maps on Census Reporter reveal suburb gradients 50% above cores. For movers, plot your household income percentile Texas-wide against these to pinpoint fits: Austin for tech ambition, DFW/San Antonio for growth value, Houston for stability. This data streamlines choices, matching earnings to neighborhoods with optimal schools and amenities, as one recent report notes Austin’s unique dip amid gains elsewhere KXAN Income Report.
Top Neighborhoods by Income Percentile
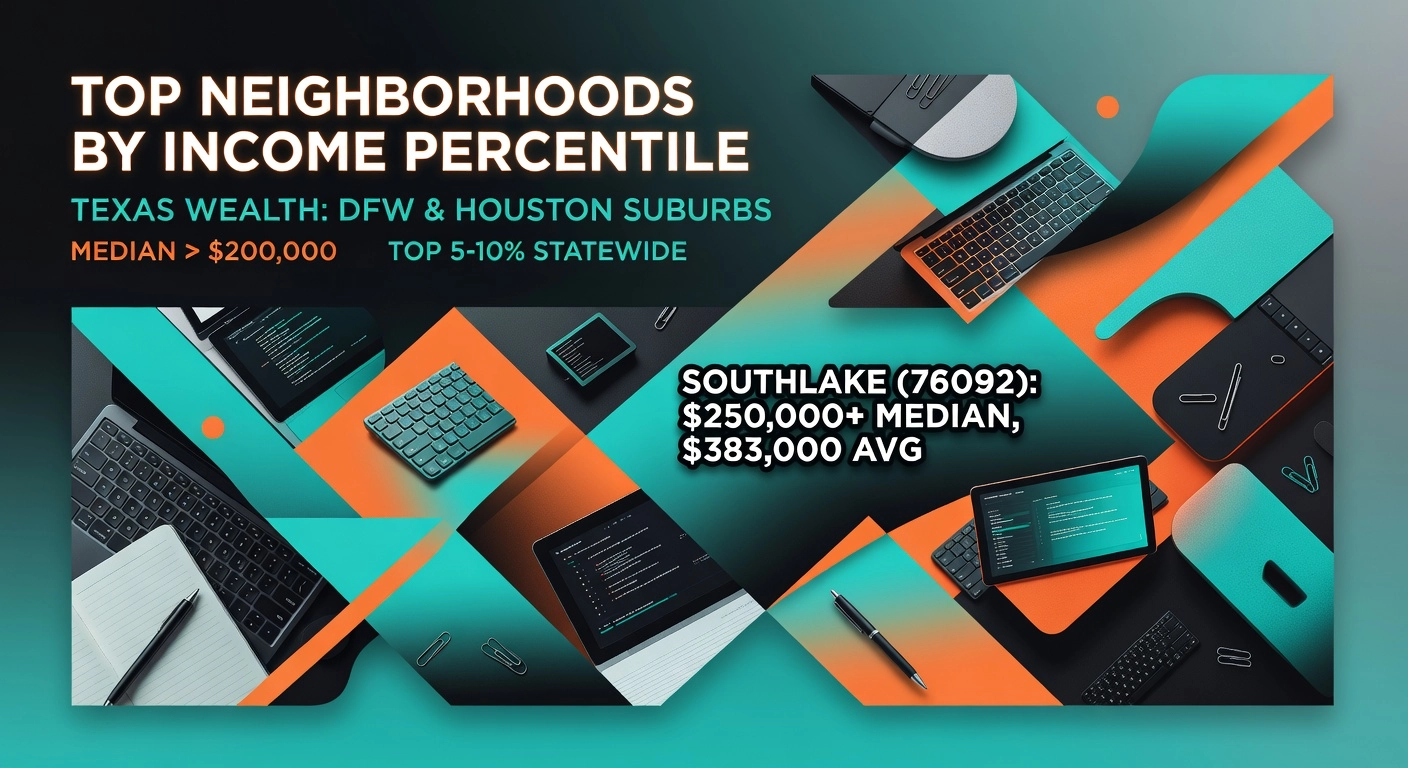
Richest Neighborhoods (Top 5-10% Thresholds)
Texas’s wealthiest areas cluster in upscale suburbs around Dallas-Fort Worth and Houston, where median household incomes exceed $200,000, placing residents in the top 5-10% statewide and often nationally. Southlake (ZIP 76092) leads with a median household income over $250,000 and an average of $383,015, supported by elite Carroll Independent School District, low crime rates, and median home values surpassing $1.5 million. These neighborhoods attract executive families who value luxury estates, proximity to DFW Airport, and community amenities like town centers and parks. Similarly, Dallas’s 75225 (Preston Hollow area) boasts a $200,234 median and $356,169 average, with 46% of households above $200,000, Highland Park ISD excellence, and estates averaging $2 million. Houston’s 77010 (Downtown/Midtown) stands out at $189,315 median and a staggering $404,356 average, driven by high-rise condos for childless professionals in finance and energy. For cross-state movers, these spots offer prestige but demand incomes well above the Texas median of $78,476 to avoid lifestyle strain. Data from recent analyses confirm their top U.S. rankings, making them ideal for high earners seeking status without coastal costs. Texas ZIP code income data
Mid-Range Neighborhoods ($75,000-$100,000: Top 40-50%)
Households earning $75,000 to $100,000 rank in Texas’s top 40-50%, comfortably above the median and perfect for stable family life in Dallas-Fort Worth (DFW) or San Antonio (SA) suburbs. These areas feature A-rated schools, moderate home prices ($400,000-$600,000), and 20-30 minute commutes to job hubs. In DFW, Richardson (ZIPs 75080/75081) offers around $90,000 medians with Richardson ISD in the top 10 metro districts, plus parks and tech proximity. Euless (76039/76040) at $80,000 provides Grapevine-Colleyville ISD strengths and growth potential, with population up 10% recently. SA options like Schertz/Cibolo (78108/78154) hit $90,000-$95,000 medians, Randolph ISD A-ratings, and lower costs than DFW, with homes around $350,000. Live Oak/Universal City ($80,000) leverages North East ISD for academics. Movers benefit from these balanced locales, where dual incomes stretch further amid metro medians like DFW’s $92,700.
Lower Percentile Options (Bottom 50%, Under $78,000)
For incomes below the median, rural West/South Texas or select urban cores deliver low cost of living (20-40% below national averages) and opportunity. Brownsville (78520, $50,000 median) suits retirees with homes under $200,000 and improving trends. Harlingen (78550, $45,000) offers budget-friendly utilities and family budgets around $2,000 monthly. Urban examples include Houston’s 77091 ($35,000, rents $1,000) for job access or SA’s 78210 ($45,000) near amenities. These avoid high-crime pitfalls while providing value for movers prioritizing affordability over flash.
Streamline Your Move with settleSavvy.ai
Input your household income percentile into settleSavvy.ai for instant neighborhood matches factoring schools, crime (three metrics), home values, and more across Texas metros. It generates visual maps in two minutes, scoring fits like 92% for a $150,000 family in low-crime, A-school suburbs. Free and mover-focused, it simplifies cross-state decisions by highlighting value without guesswork.
Case Study: $150,000 from California
A California household at $150,000 (top 35-40% there) enters Texas’s top 20-25%, fitting upscale like The Woodlands (77380/77389, $140,000-$141,000 median, Conroe ISD A-rated, $450,000+ homes) or Westlake (76262, $250,000+). With 25-40% COL savings versus CA, CA migrants (avg. $114,000) thrive here amid 7% outflows to Texas burbs. Texas top 5% income thresholds
Income by Age and Household Type
Household income in Texas varies significantly by age group and household type, providing key insights for cross-state movers evaluating where their earnings fit within local percentiles. Understanding these breakdowns helps you pinpoint neighborhoods that align with your financial profile, avoiding lifestyle mismatches and easing the relocation process. Data from the latest American Community Survey (ACS) 2024 estimates reveal clear patterns: earnings peak during mid-career years before dipping in retirement.
Income by Age Group
Younger households under 25 have a median income of $42,913, placing most in the lower percentiles as entry-level workers or students dominate this group. The 25-44 cohort sees a sharp rise to $84,761 median, reflecting career advancement and dual-income young professionals; this group comprises 37.5% of Texas households and often exceeds the state median in tech-driven areas. Peak earnings hit $94,780 for 45-64 year-olds, where 59% surpass the U.S. median, fueled by established careers and family stability. Retirees aged 65+ drop to $56,912, relying more on fixed incomes like Social Security. For beginners, visualize this with a simple bar chart from Neilsberg research on Texas median household income by age, showing the mid-life surge clearly. These figures, adjusted for inflation, grew across all groups from 2013-2023, outpacing national trends in younger brackets.
Family vs. Single Households
Family households, making up 71% of Texas’s 11 million households, boast a median of $94,599, far outpacing non-family or single-person units at $42,599. Larger families benefit from multiple earners and skew higher in suburbs, where space supports child-rearing and commuting to high-wage jobs. For instance, Dallas-Fort Worth suburbs like Plano exceed state averages by 20-50%, placing families in upper percentiles. Singles cluster in urban cores, pulling city medians down but offering affordability. Movers can use Census Reporter’s Texas profile for distribution charts that highlight these urban-suburban gaps, simplifying neighborhood selection.
Mover Relevance and Projections
Young professionals (25-44) gravitate to Austin’s $99.9k metro median, boosted by tech jobs, while families target DFW’s $92.7k with superior schools. This migration elevates high-earner metros, widening suburb advantages. Projections show modest 2% annual growth through 2026, with in-migration lifting Austin and DFW medians 3-5%; statewide median holds near $80,800. For movers, compare your household income percentile against these to target fitting areas, streamlining your Texas move with confidence. Interactive tools like DQYDJ’s percentile calculator make this beginner-friendly, turning data into actionable neighborhood matches.
Key Trends and 2026 Projections
Texas household income percentiles are evolving steadily, offering cross-state movers a predictable landscape for neighborhood selection. Recent data shows a modest year-over-year growth of 2.2 percent, pushing the median to approximately $79,700 in 2024, the highest on record. This figure, drawn from inflation-adjusted Census and FRED sources, positions Texas slightly below the national median of $81,604 while signaling resilience amid ongoing inflation pressures. Projections indicate stability through 2026, with medians holding between $78,000 and $82,000 as metro gains in Dallas-Fort Worth and San Antonio offset flatter trends in Austin and Houston. For movers, this consistency means your current income percentile is likely to maintain relative purchasing power, simplifying comparisons to local benchmarks like the 75th percentile at $152,118.
Stable Inequality with a Middle-Class Bulge
Texas maintains a stable Gini coefficient of around 0.479, reflecting moderate income inequality comparable to the U.S. average. Unlike states with ultra-high earners dominating the top end, Texas has a higher concentration of households in the $50,000 to $100,000 range, peaking at 13 percent in the $75,000 to $100,000 bucket by 2026 projections. This distribution, where the middle 20 percent averages $76,906, creates a broader middle-class footprint than national norms, with fewer extremes at the top 1 percent threshold of $645,402. Movers benefit from this structure, as it reduces lifestyle inflation pressures in many neighborhoods and aligns well with out-of-state incomes in the 25th to 75th percentiles ($42,656 to $152,118). Actionable insight: Target suburbs where your household income falls in the local 60th to 80th percentile for optimal school access and amenities without overextending.
In-Migration Boosting High-Earner Metros
In-migration continues to shape percentiles, particularly in Austin and Dallas-Fort Worth, where high-earner influxes from tech and finance sectors elevate upper brackets. Net domestic moves added thousands of affluent households in recent years, pushing top 5 percent averages toward $487,000 in these areas while widening gaps between urban cores and rural zones. Austin’s median dipped slightly to $99,900, yet DFW climbed 3.7 percent to $92,700, reflecting this dynamic. For cross-state movers, this means high-income relocators (above $150,000) can slot into premium neighborhoods like Southlake, enhancing percentile rankings locally.
Cost-of-Living Edges for Movers
Texas’s lower cost of living, 5 to 7 percent below high-tax states, amplifies income advantages through no state income tax and affordable housing at $1,962 monthly averages. This boosts effective purchasing power; a $80,000 household here equates to more than in California equivalents. Movers from pricier regions gain 5 to 10 percent in disposable income, ideal for climbing percentiles in value-driven neighborhoods.
2026 Outlook: Tech and Jobs Prop Upper Tiers
Looking ahead, Dallas Fed forecasts 1.9 percent job growth in 2026, driven by tech roles paying $174,000 medians, sustaining upper percentiles amid 2 percent economic expansion. This will modestly lift medians while bolstering high-earner hubs, aiding movers in securing future-proof neighborhoods. Texas median household income data underscores this trajectory, empowering informed relocation decisions.
Using Percentiles for Your Texas Move
Step 1: Find Your Percentile Using State Tools
Determining your household income percentile in Texas is the foundational step for any cross-state move, providing a precise benchmark against the state’s 11 million households. Begin with reliable, free calculators based on the latest 2024 American Community Survey data and 2025 projections. For instance, input your pre-tax household income into tools like the DQYDJ Income by State calculator, selecting Texas to reveal your rank. Current benchmarks show the 25th percentile at around $42,000, the median (50th) at $80,800, the 75th at $152,000, and the top 1% threshold near $645,000. A household earning $100,000 places you comfortably in the top 40% statewide, offering leverage in most metros. This quick assessment, taking under two minutes, empowers beginners to understand their relative position before exploring neighborhoods.
Step 2: Compare to Target Metro and Neighborhood Medians
Once you know your percentile, compare it directly to your desired Texas metro and neighborhood medians to assess fit. Texas metros vary significantly: Austin’s median stands at $99,900, Dallas-Fort Worth at $92,700, Houston at $81,400, and San Antonio at $78,100, per 2024 Census data. Neighborhoods amplify these differences; affluent areas like Houston’s 77010 zip code boast medians over $189,000, while Southlake near Dallas exceeds $250,000. If your $90,000 household income ranks in the 55th percentile statewide but drops to the 45th in high-earning Austin suburbs, you might face stretched affordability. Actionable insight: target areas where your income exceeds the local median by 20% or more, such as Houston suburbs for mid-range earners. This comparison prevents overreaching and highlights value-driven spots.
Step 3: Factor in Cost of Living, Schools, and Amenities via SettleSavvy.ai
Percentiles alone overlook critical lifestyle factors, so integrate cost of living (COL), schools, and amenities using SettleSavvy.ai, our AI tool designed for cross-state movers. Texas COL averages 8% below the national figure, but Austin and Dallas run 10-20% higher due to housing, while San Antonio and Houston offer savings. Enter your income percentile alongside priorities like school ratings or park access; the platform analyzes 50+ data points to score neighborhoods. For example, a $110,000 household might score high in Fort Bend County near Houston for strong schools, low crime, and amenities matching top-50% peers. Results appear as interactive maps in minutes, adjusting for Texas’s no-income-tax advantage. This step simplifies decisions, ensuring your move aligns with financial reality and family needs.
Avoid Pitfalls: High-Percentile Areas Raise ‘Keeping Up’ Pressure
Steer clear of high-percentile enclaves where social pressures inflate costs. Areas like Dallas’s 75225, with medians around $200,000, foster “keeping up with the Joneses” through luxury homes and exclusive amenities, eroding savings despite absolute gains. Texas’s Gini index of 0.479 signals inequality, with top 20% households capturing over half the income, amplifying peer effects in suburbs like The Woodlands (median $110,000). Beginners often overlook how dropping 20 percentiles locally reduces satisfaction; studies show relative income drives happiness more than raw dollars. Mitigate by aiming for top-60% fits in medians of $70,000-$90,000, preserving financial flexibility.
Personalized Recommendations: Enter Income for Neighborhood Matches
For tailored advice, input your income directly into SettleSavvy.ai to generate neighborhood matches. A $120,000 household, for instance, pairs well with Sugar Land suburbs (median $91,000), offering top schools like Clements High and low COL versus Austin. Combine this with percentile data: prioritize financial peer fit (30% weight), education (20%), and amenities. Cross-check projections showing stable 2-3% growth to 2026 medians around $78,500-$80,000. This personalized approach streamlines your Texas move, landing you in thriving communities without lifestyle creep.
Actionable Takeaways for Movers
Texas delivers exceptional value for cross-state movers, with a statewide median household income hovering around $80,000, slightly below the national average yet paired with lower living costs and no state income tax. This positions Texas as a smart choice for families and professionals seeking affordability without sacrificing opportunity. High earners will find prime suburbs like Southlake (median over $250,000) and Houston’s 77010 zip code (median $189,000, average $404,000) where top 5-10% thresholds align with elite lifestyles. Metro variations add nuance: Austin at $99,900, Dallas-Fort Worth at $92,700, Houston at $81,400, and San Antonio at $78,100, all showing modest growth into 2026. By understanding your household income percentile in Texas, you benchmark against these realities to avoid overextending financially.
Calculate Your Percentile and Explore Neighborhood Fits
Start by determining your exact household income percentile using reliable state-level calculators, which reveal if you fall in the peak $75,000-$100,000 bucket (13% of households) or the top 12% above $200,000. This step clarifies your standing amid Texas’s 11 million households and income inequality (Gini 0.479). Then, turn to settleSavvy.ai to match your percentile with ideal neighborhoods, factoring in schools, amenities, and affordability. For instance, a $120,000 household ranks around the 70th percentile statewide, unlocking mid-tier suburbs in Dallas with strong community vibes.
Pro Tip: Target Peer-Income Neighborhoods
Selecting areas where residents share your income percentile fosters belonging and financial ease, minimizing the “keeping up with the Joneses” pressure. Movers in the 75th percentile ($141,000-$152,000) thrive in peer zones with similar $90,000-$150,000 medians, cutting lifestyle inflation and boosting savings on housing. Data shows this approach enhances satisfaction, as high-earner clusters like Dallas 75225 (median $200,000) offer tailored amenities without excess costs.
Next Steps for Your Move
Compare metro medians to prioritize: Dallas-Fort Worth’s 3.7% growth suits upwardly mobile families, while stable Houston fits steady earners. Review 2026 projections showing medians steady at $78,000-$80,000 with top 5% averaging $494,000. Launch your home search now, aligning searches with your percentile for quick wins.
Moving to Texas? Align your income percentile with lifestyle needs for enduring satisfaction and seamless integration.
Conclusion
In this 2026 Texas household income percentile breakdown, key takeaways include precise thresholds from the bottom 10% at modest earnings to the top 1% surpassing seven figures, stark regional variations between urban hubs like Austin and rural areas, and critical influences such as job markets and cost of living. You now have the tools to pinpoint your household’s exact rank, benchmark against state averages, and uncover actionable steps for budgeting or career growth.
This data empowers you to make smarter financial decisions and climb the income ladder with confidence. Calculate your percentile today using the thresholds provided, then apply these insights to your next investment or goal-setting session. Your Texas financial future starts here; seize it now and build the prosperity you deserve.


One Comment