Average Household Income in Iowa: 2026 Breakdown
Imagine waking up in the heart of Iowa, where vast cornfields meet bustling small towns, and wondering just how far your paycheck stretches. As living costs rise and economic shifts reshape the Midwest, understanding the average household income in Iowa becomes essential for families, job seekers, and anyone eyeing a move to the Hawkeye State. In this 2026 breakdown, we deliver clear, data-driven insights tailored for beginners.
We examine the latest projections from trusted sources like the U.S. Census Bureau and state economic reports. You will discover the statewide average household income, which hovers around key benchmarks influenced by agriculture, manufacturing, and tech growth. We break it down by regions, from Des Moines’ urban hubs to rural counties, highlighting disparities and trends. Learn what factors drive these numbers, such as wage growth, inflation adjustments, and policy changes. Plus, we compare Iowa to national figures and neighboring states, so you grasp where the state stands.
Whether you are budgeting for a home, evaluating career options, or simply curious about Iowa’s financial landscape, this analysis equips you with actionable knowledge. Stay tuned as we unpack the numbers that matter most.
Iowa Statewide Household Income Overview
When considering a cross-state move to Iowa, understanding the average household income in Iowa is crucial for gauging affordability and lifestyle fit. For beginners evaluating neighborhoods, distinguishing between mean (average) and median household income provides a clear picture of cost-of-living realities. The median household income represents the midpoint where half of households earn more and half earn less, offering a realistic benchmark unaffected by outliers like high-earning executives. In contrast, the mean household income divides total income across all households, often inflated by top earners, giving a broader view of economic output. For movers, the median is especially relevant since it better predicts everyday expenses like housing, where Iowa’s median home value hovers around $208,000, stretching dollars further than in high-cost states. This distinction empowers you to align your budget with typical neighborhood economics, simplifying the relocation process.
Recent U.S. Census American Community Survey (ACS) 5-year estimates for 2020-2024 peg Iowa’s median household income at $75,059, with per capita income at $40,877 (U.S. Census QuickFacts for Iowa). These figures reflect stability across roughly 1.3 million households, bolstered by sectors like agriculture and manufacturing. Modeled data paints a different picture for the mean: Point2Homes reports $95,968 for 2023, while IncomeByZipCode projects $98,187 for 2025-2026 (Iowa Income Data and Projections). The gap highlights income skewness, yet both metrics position Iowa at about 93% of the national median of $78,538, ranking it 31st among states. For cross-state movers, this means enhanced purchasing power; a family earning $80,000 elsewhere might live like one earning $100,000 in Iowa due to lower costs. Use these stats to prioritize neighborhoods in high-median counties like Dallas ($102,349) for optimal value.
Iowa’s poverty rate of 11.3% (2020-2024 ACS) sits below the U.S. average of around 11.5-12%, indicating broad economic stability (Iowa Census Profile). This affects fewer than 370,000 residents, mostly in rural areas, supported by low unemployment at 3.3% and family-oriented policies. Relocating families benefit from reliable schools, community resources, and minimal social strains, reducing relocation risks. Compared to coastal states with higher poverty, Iowa offers a safer economic landing pad, making neighborhood selection straightforward.
Projections for 2026 forecast mean household income reaching $98,187, driven by 2-3% annual growth in ag exports and remote work. This upward trend, with nominal median growth of about 3% from 2020-2024, underscores Iowa’s affordability for cross-state moves, where housing costs 40% below national averages amplify income value. Movers from states like Illinois ($82,000 median) could see 15-20% effective gains.
For quick insights, compare Iowa’s $75,059 median to the national $78,538 via this table:
| Metric | Iowa | National |
|---|---|---|
| Median Household Income | $75,059 | $78,538 |
| Poverty Rate | 11.3% | ~11.8% |
Visualize trends with Census charts showing steady 2% CAGR since 2010, aiding beginners in spotting stable neighborhoods. These tools streamline your move by highlighting value-packed areas.
Top Iowa Counties by Household Income
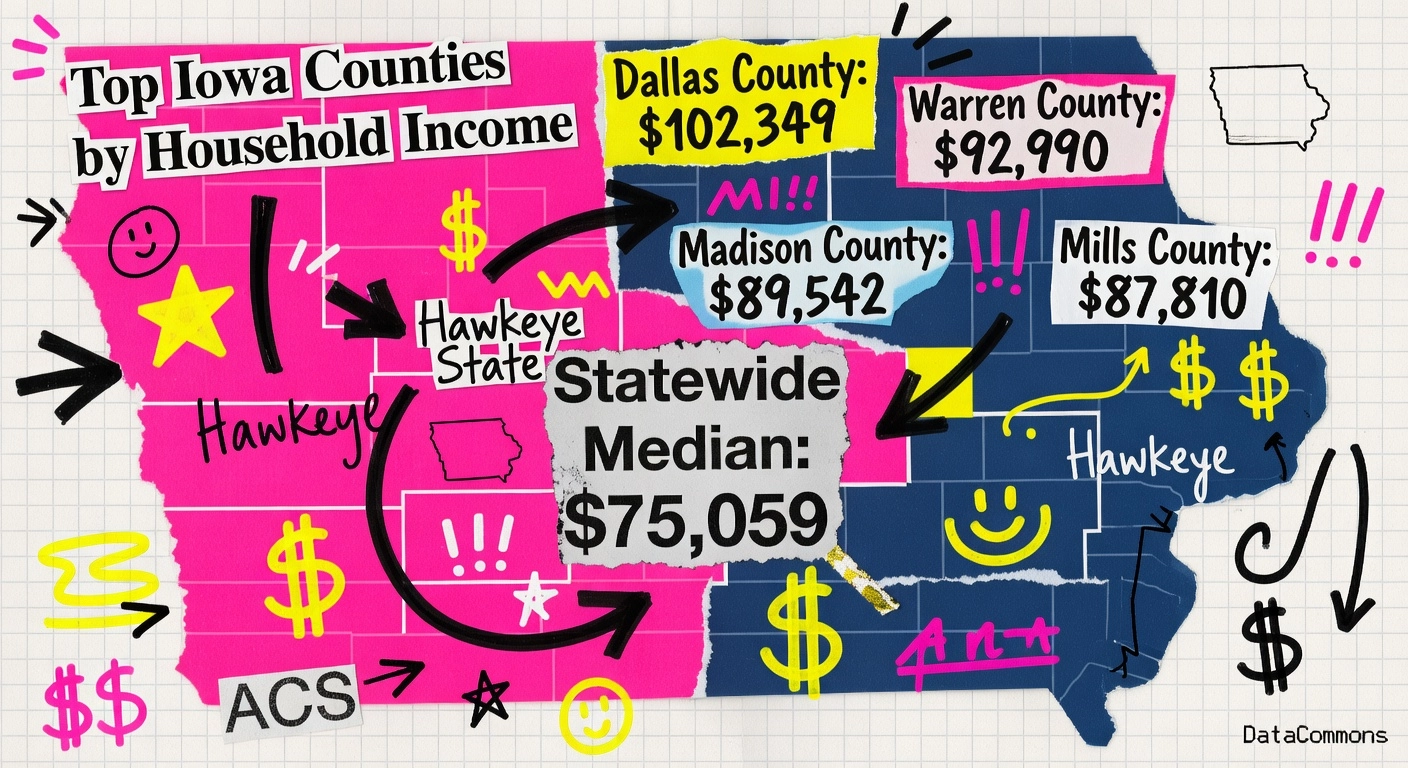
Dallas County leads Iowa with a median household income of $102,349, followed closely by Warren County at $92,990, Madison County at $89,542, and Mills County at $87,810, according to DataCommons rankings from recent ACS data. These figures significantly outpace the statewide median of about $75,059, representing 25 to 40 percent higher earnings that appeal to professionals relocating from higher-cost states. For cross-state movers, targeting these counties means aligning with areas where average household incomes approach $98,000 in projections for 2025-2026, offering stability and growth potential. This ranking highlights how suburban strengths elevate local economies beyond rural norms.
Why These Counties Attract Higher Earners
Proximity to Des Moines, Iowa’s primary job hub, draws high earners to Dallas, Warren, Madison, and Mills counties. Commuters in Dallas County suburbs like Waukee access finance, insurance, and tech roles in the metro area, while Warren’s Norwalk and Indianola provide quick drives to government and professional services. Low unemployment rates further boost appeal; Dallas sits at 2.9 percent, Warren around 3.0 percent, compared to the state average of 3.5 percent. Top schools, parks, and low crime rates support family relocations, with Dallas County adding 18,000 residents from 2020 to 2025, the fastest growth in the Midwest. Dual-income households thrive here due to office parks and upscale developments since the 1990s. For movers, this means job security and lifestyle upgrades without coastal price tags.
Affordability for $100k+ Households
Iowa’s median home value hovers around $220,000 to $241,000 statewide, creating favorable price-to-income ratios. In Dallas County, medians reach $333,000 to $390,000, yet a 3.2x ratio against $102,349 incomes keeps housing under 30 percent of earnings for $100,000-plus households. Warren’s $252,800 homes yield similar affordability at about 2.7x its median. This contrasts sharply with national medians near $410,000, making these counties ideal for budget-conscious relocations. Movers benefit from value that stretches incomes further, easing the transition to Iowa living.
Matching Neighborhoods for Seamless Moves
To simplify your move, leverage neighborhood analysis tools that filter suburbs by income brackets, schools, and amenities within these counties. For instance, match $100k households to Waukee in Dallas or Norwalk in Warren for optimal fit. Our expertise helps cross-state movers pinpoint these spots, ensuring alignment with your financial profile and preferences.
In contrast, rural counties like Appanoose ($51,146 median) and Decatur (around $56,000) lag at 70 percent or less of the state average, tied to agriculture volatility and higher unemployment over 4 percent. This income diversity underscores Iowa’s range, from metro prosperity to rural challenges, guiding movers to the best match. Explore county trends here. See richest counties data.
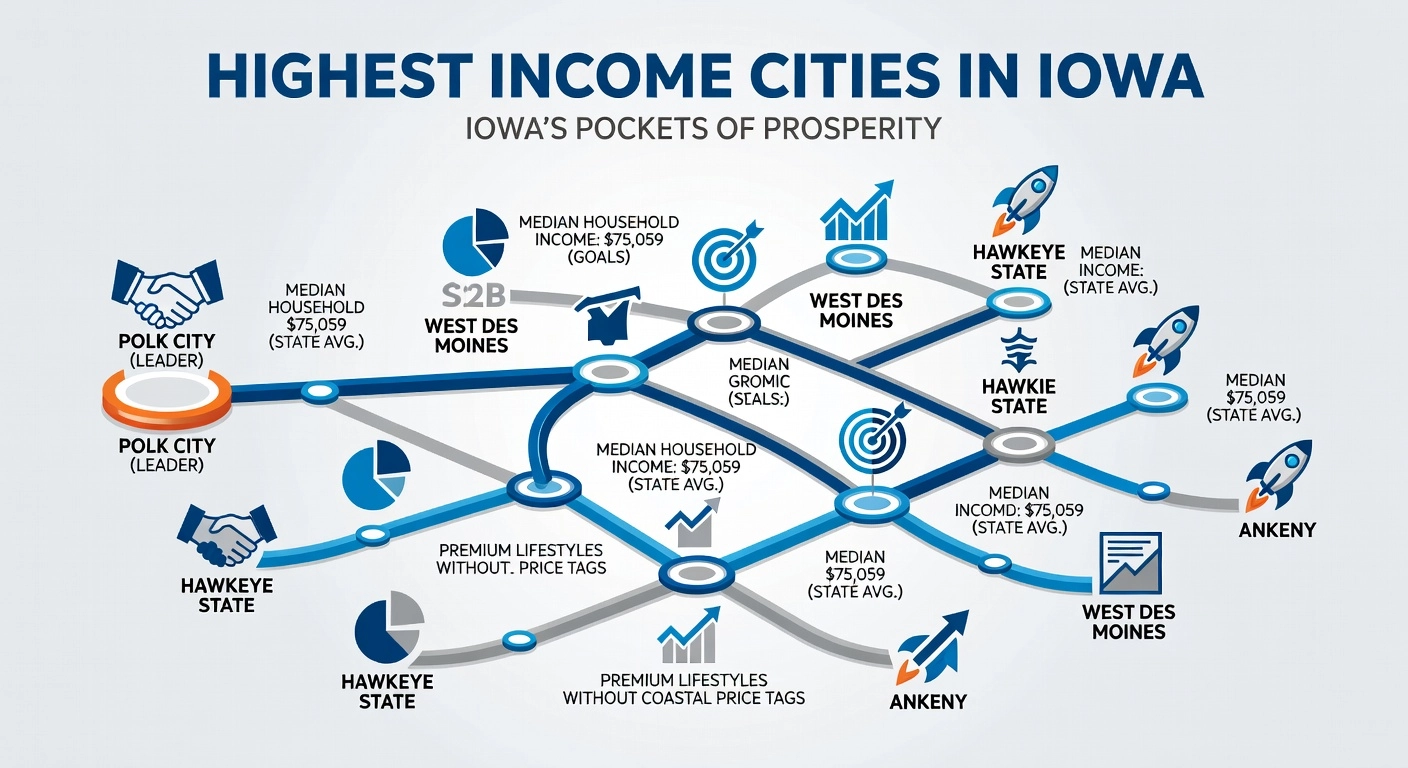
Highest Income Cities in Iowa
Iowa’s highest-income cities offer a glimpse into pockets of prosperity that far exceed the state’s median household income of $75,059, providing cross-state movers with premium lifestyle options without the coastal price tags. According to DataCommons city rankings, Polk City leads with a median household income of $163,000, followed by Lake Panorama at $149,722 and Van Meter at $133,750. These figures, drawn from American Community Survey data, highlight affluent communities where households thrive on professional salaries from nearby urban hubs. Updated Census estimates refine these slightly: Polk City at $164,389, Van Meter at $135,139, and Lake Panorama at $126,563, reflecting steady growth amid Iowa’s 3% nominal income rise from 2020 to 2024. For movers, these leaders signal neighborhoods where high earners cluster, easing the search for compatible budgets and amenities.
Demographics of Iowa’s Wealthiest Cities
These top cities share traits as affluent suburbs or resort enclaves with exceptional schools and convenient commutes to Des Moines, Iowa’s economic core. Polk City, in Polk County with a population of about 6,430, boasts 98.4% high school graduation rates and 44.2% bachelor’s degrees or higher among adults; its 89.1% homeownership rate and low 6.7% poverty underscore family appeal, with a 20-30 minute drive to Des Moines jobs in finance and insurance. Lake Panorama, a Guthrie County gem of roughly 928 residents, caters to retirees and families with resort perks like private lakes, golf, and trails; 98% White demographics pair with strong Panorama Community Schools and a 45-60 minute commute. Van Meter, in high-income Dallas County (state-leading $102,349 median), serves 1,800 people with top-ranked Van Meter Community Schools, poverty below 3%, and a quick 25-minute trip downtown; median homes here range $305,000-$445,000. Low crime, high education, and suburban tranquility draw professionals seeking balance.
Value for Cross-State Movers
High incomes—often double the state average—fuel luxury amenities like golf resorts and spacious homes, yet Iowa’s median home value of $208,000 stays 50% below the national $426,800, per recent trends. Movers gain affordability: a $400,000 Polk City home rivals national starter prices while supporting upscale living. This value accelerates relocation by matching incomes to neighborhoods with rising inventory and low unemployment (3.3%).
Actionable Neighborhood Filtering
Streamline your move by filtering via U.S. Census Bureau QuickFacts, DataCommons, or DataUSA Iowa profile; prioritize income data alongside schools and commutes for budget fits—from $130,000+ luxury suburbs to balanced options.
In contrast, Des Moines offers urban diversity at $65,932 median income, with vibrant amenities, varied demographics, and $194,700 homes—perfect for flexible relocations. Check Iowa home trends to compare.
Household Income Trends and 2026 Projections
Iowa’s household income trends reveal a pattern of steady, resilient growth, making the state an appealing destination for cross-state movers seeking predictable financial landscapes. The median household income, a key benchmark closely aligned with the average household income in Iowa, experienced nominal growth of about 3% from $72,959 in 2020 to over $75,059 by 2024, according to U.S. Census ACS 5-year estimates and FRED data. This modest uptick reflects post-pandemic recovery, with longer-term data showing even stronger momentum: a cumulative 6.53% nominal increase from $68,662 in 2010 to $73,147 in 2023, as detailed by Neilsberg population insights. For movers, this consistent rise signals neighborhoods where living costs align well with earning potential, especially when paired with Iowa’s median home values around $208,000. Beginners planning a relocation can use these figures to budget effectively, anticipating that income growth outpaces many regional peers without the volatility of coastal markets.
Inflation-Adjusted Growth and Historical Stability
When adjusted for inflation, Iowa’s median household income demonstrates remarkable steadiness, climbing from $82,540 in 2020 to $85,480 in 2024 in chained dollars, per FRED’s real median income series. This real-term gain of over 3.6% underscores resilience amid economic pressures like supply chain disruptions and rising costs. Historically, from 2010 to 2023, the state saw nine years of income increases compared to just four declines (notably in 2012, 2013, 2022, and 2023), painting a picture of low-risk upward trajectory. Such patterns offer movers confidence in long-term financial stability, as Iowa’s economy, bolstered by agriculture, manufacturing, and a growing Des Moines metro, weathers cycles better than many states. Actionable insight: Target neighborhoods in high-growth counties like those previously highlighted, where this stability translates to sustained affordability and home equity buildup.
2025-2026 Projections
Looking ahead, projections point to an average household income reaching $98,187 by 2025-2026, driven by modeled ZIP-level data and a low unemployment rate of 3.3%, per DataCommons rankings. This upward path assumes a 3-4% annual nominal growth continuation, fueled by labor force expansion of over 32,400 workers in 2025 and tight job markets. For cross-state movers, these forecasts mean enhanced buying power in neighborhoods with strong job anchors, reducing relocation risks. Beginners should factor this into decisions, prioritizing areas with per capita incomes near $40,877 for family-friendly stability.
Age Group Variations
Income varies significantly by age, with households headed by 45-64-year-olds topping at $90,341 median, ideal for mid-career professionals eyeing prime neighborhoods. In contrast, seniors aged 65+ average $53,593, reflecting retirement dynamics but still supported by Iowa’s below-average 11.3% poverty rate. Younger groups under 25 lag at $44,804, while 25-44-year-olds hit $83,572, showing prime earning windows. Movers in peak years can leverage this for upscale options, while retirees find value in lower-cost areas.
Visualizing Trends for Long-Term Planning
Graphs from FRED’s nominal series and Neilsberg illustrate these trends clearly: a steady climb post-2020 with minimal dips, helping predict neighborhood viability over decades. For movers, reviewing these visuals simplifies forecasting personal finances, ensuring Iowa’s steady outlook eases the transition to new communities.
Iowa Income vs. National and Peer States
Iowa’s median household income of $75,501 in 2024 places it around 34th nationally, representing about 90% of the U.S. median of $83,730, according to the latest American Community Survey data. This middle-of-the-pack ranking aligns with earlier 2023 figures from Neilsberg, which pegged Iowa at 31st with $73,147 or 93% of the then-national median of $78,538. The state’s average household income, however, tells a fuller story at $98,187, skewed higher by prosperous pockets like Dallas County’s $102,349 median. For cross-state movers, this steady income level signals reliability, especially with recent 3% nominal growth outpacing national trends amid low unemployment around 3.5%. Beginners should note that while not topping charts, Iowa’s incomes support a stable middle-class lifestyle, with 41% of households exceeding $100,000.
Coastal states starkly contrast Iowa’s profile, amplifying its affordability appeal for movers. California’s median household income hits $100,600, over 33% higher than Iowa’s, yet median home prices soar past $800,000, crushing purchasing power. Similar patterns emerge in top-five earners like Massachusetts ($104,828) and New Jersey ($104,294), where incomes 25% above national averages pair with homes over $500,000. Movers from these high-cost areas often seek Iowa’s value, where lower taxes and a cost-of-living index 10-15% below average stretch dollars further. This disparity drives migration flows, as remote workers and families prioritize livability over peak earnings.
Even against mover-popular peers like Texas, Iowa shines in value. Texas boasts a slightly higher median of $79,721, but median homes average $320,000 with property taxes at 1.7% effective rates. Iowa counters with homes around $228,000 and a mere 0.5% tax burden, yielding a home-to-income ratio of about 2.3x its median, versus 3x nationally. Midwest neighbors like Minnesota ($90,000 median) face $330,000 homes, while Wisconsin and Nebraska hover near Iowa’s income but with rising costs. For movers, Iowa’s equation means more home for less strain, easing the transition to neighborhoods matching budgets.
| State/Region | Median Household Income (2024) | % of National ($83,730) | Median Home Price (2026 Est.) |
|---|---|---|---|
| National | $83,730 | 100% | ~$410,000 |
| Iowa | $75,501 | 90% | $227,764 |
| MA (Top 5) | $104,828 | 125% | ~$600,000+ |
| NJ (Top 5) | $104,294 | 125% | ~$500,000 |
| MD (Top 5) | $102,905 | 123% | ~$420,000 |
| CA (Top 5) | $100,600 | 120% | $800,000+ |
| TX (Peer) | $79,721 | 95% | $320,000 |
| MN (Midwest) | ~$90,000 | 107% | ~$330,000 |
| WI (Midwest) | ~$74,600 | 89% | ~$290,000 |
This table underscores Iowa’s edge: superior affordability despite modest incomes. Cross-state movers can leverage this by targeting high-income counties like Dallas or Warren, where averages near $98,000 align with sub-$250,000 homes for seamless settling.
Income Data for Iowa Relocation Decisions
Affordability Insights from Iowa’s Average Household Income
Iowa’s average household income of $98,187 provides a strong foundation for relocation decisions, particularly when calculating home affordability. Financial experts recommend limiting housing costs to 3 to 4 times annual household income, which means a typical Iowa family can comfortably target homes priced between $294,000 and $392,000. This range aligns perfectly with median home values around $265,000 statewide and even better in top counties like Dallas and Warren, where properties often stay under 3.5 times local incomes. For cross-state movers, this metric simplifies budgeting; subtract 20 to 30 percent for housing from your expected Iowa earnings to gauge realistic options. In Dallas County, with a median income of $102,349, median homes at about $368,000 represent just 3.6 times income, offering equity-building potential without strain. Warren County’s $92,990 median supports homes from $270,000 to $315,000, keeping monthly payments manageable at under 28 percent of income for most households.
Leveraging Income Data with Neighborhood Selection Tools
Cross-state movers can streamline their search by using income statistics alongside intuitive filtering tools like SettleSavvy.ai. Start by inputting your projected household income, such as $80,000 to $100,000, then layer on preferences for schools, commute times, and cost-of-living adjustments specific to Iowa counties. SettleSavvy.ai processes these in about two minutes, highlighting matches in high-income areas like Dallas or Warren where local medians exceed the statewide $75,059 figure. This approach reveals neighborhoods with strong resale value and upward mobility, as areas above the state average often appreciate faster. Beginners benefit from cross-referencing free resources like Census QuickFacts for precise county data, ensuring your choice fits long-term family goals. Actionable step: Filter for income brackets 10 to 20 percent above your own to future-proof against rising costs.
Why Iowa’s Income Stability Appeals to Cross-State Movers
For families relocating from high-cost states, Iowa’s average household income delivers unmatched budget stability. With a cost of living 6 percent below the national average, housing 18 percent cheaper, and utilities 6 percent lower, a $98,187 income stretches 15 to 20 percent further than in California or New York. Post-tax and essentials, Iowa households retain about $44,000 annually, compared to far less in coastal states where the same earnings cover 20 to 30 percent less housing. Des Moines metro exemplifies this, with a 15.9 percent lower COL equivalent to boosting $70,000 wages to $83,000 nationally. Poverty rates at 11.1 percent, below the U.S. average, underscore family-friendly security. Movers gain immediate purchasing power, easing the transition to Iowa’s predictable economy.
Key Job Sectors Fueling Iowa Incomes
Iowa’s job market drives its average household income through diverse, stable sectors, simplifying relocation planning. Agriculture remains foundational despite recent challenges, while manufacturing contributes 16 to 18 percent of GDP with 43,000 Des Moines-area jobs at $77,000 average wages. The Des Moines metro shines in finance and insurance, offering 52,000 positions with $124,000 wages and a location quotient of 2.64, plus growing tech and professional services at $100,000 averages. Overall employment stands at 499,000 with 0.5 percent projected growth to 2026 and 3.3 percent wage increases. Low unemployment at 3.3 percent ensures quick job placement for movers. Target these hubs for incomes matching or exceeding the $98,187 average.
Case Study: $80,000 Household in Warren County Suburbs
Consider an $80,000 household thriving in Warren County suburbs, where the $92,990 median income and low 6.6 percent poverty rate create ideal value. Homes at $270,000 to $315,000 equate to 3.4 to 3.9 times income, fitting under 30 percent of monthly budget with top schools like Norwalk and Carlisle districts ranking statewide. Proximity to Des Moines jobs in tech and manufacturing cuts commutes, boosting work-life balance. Per capita income near $44,000 supports family amenities without urban premiums. This setup exemplifies how Iowa’s averages enable strategic moves for education and savings. Relocators using income-aligned tools confirm Warren as a top pick for lasting affordability.
Factors Shaping Iowa Household Incomes
Iowa’s average household income, projected to reach $98,187 by 2025-2026, varies significantly due to a mix of industries, demographics, and economic stability. These elements create distinct opportunities across rural and urban areas, helping cross-state movers identify neighborhoods that align with their earning potential and lifestyle goals. Understanding these drivers simplifies the relocation process by highlighting where incomes are strongest and most predictable.
Key Industries Driving Income Variations
Manufacturing and agribusiness form the backbone of rural Iowa incomes, providing stable, above-average wages that exceed state norms. For instance, manufacturing jobs in machinery, food processing, and appliances contribute to higher rural medians, while agribusiness, fueled by corn, soy, and biofuel production, supports farm-adjacent households despite market fluctuations. In contrast, urban centers like Des Moines elevate incomes through finance, insurance, and tech sectors. The Greater Des Moines metro area reports a median household income of $83,374, driven by high-wage roles in fintech and data centers that attract professionals with salaries often topping $80,000. This urban-rural divide means movers can target manufacturing-heavy counties for reliable blue-collar earnings or Des Moines suburbs for tech-driven growth. Overall, these industries have fueled a 3% nominal income rise from 2020 to 2024, enhancing Iowa’s appeal for diverse career paths.
Demographics Influencing Incomes
Family households significantly outpace non-family ones, with a median family income of $97,491 compared to lower non-family figures, thanks to dual earners and larger units. Earnings peak in the 45-64 age group at $90,341, reflecting career stability in mature sectors like manufacturing and finance. Younger households (25-44) earn around $83,572, while seniors dip to $53,593 due to retirement. Iowa’s median age of 38.6 supports this bulge in prime earning years, sustaining statewide averages. For movers, these patterns suggest family-friendly neighborhoods in high-income counties offer the best financial upside.
Low Poverty and Unemployment Boosting Relocation Confidence
Iowa’s poverty rate of 11.3% remains below the national average, providing a solid economic floor that reassures relocating families. Coupled with unemployment at 3.3-3.5%, one of the lowest nationally, this stability signals abundant job opportunities and quick employment transitions. Such metrics build confidence for cross-state moves, as low joblessness correlates with faster income recovery post-relocation.
Future Drivers and Projections
Economic diversification into biosciences, renewables, and advanced manufacturing promises continued growth, with average household incomes modeled at $98,187 for 2025-2026. Remote work trends, though cooling, have drawn professionals to affordable areas, amplifying urban inflows. These shifts position Iowa for 2-3% annual GDP growth.
Movers should layer income data with school ratings, safety statistics, and housing costs using integrated tools like Census portals or state data centers. This holistic approach pinpoints neighborhoods maximizing your financial and family fit.
Actionable Takeaways for Moving to Iowa
As you plan your cross-state move to Iowa, key statistics on the average household income in Iowa provide a clear roadmap for success. The state’s projected average household income stands at $98,187 for 2025-2026, surpassing the median of $75,059 and reflecting steady growth of about 3% nominally from 2020 to 2024. Top areas like Dallas County, with a median of $102,349, and nearby high-income cities such as Polk City at $163,000, offer premium opportunities for families seeking upward mobility. This resilient trend, bolstered by low unemployment at 3.3% and historical growth of 6.53% from 2010 to 2023, positions Iowa as a stable choice compared to volatile coastal markets. For beginners, these figures mean more purchasing power for homes averaging $208,000, easing the transition to Midwest living.
To simplify your decision, start by using settlesavvy.ai: input your household income and instantly discover matched Iowa neighborhoods tailored to your budget and lifestyle. Follow these actionable steps for a seamless move. First, compare your current budget against Iowa’s medians; if you earn above $75,059, target high-income suburbs in Dallas or Warren Counties for better schools and amenities. Second, prioritize areas with strong growth projections, like those mirroring the state’s upward trajectory to $98,187 averages. Third, verify local per capita income around $40,877 and poverty rates below the national average at 11.3% to ensure long-term affordability.
These data-driven choices unlock significant benefits, from reduced financial stress to perfect lifestyle fits in family-friendly communities. Imagine settling in Van Meter, where medians hit $133,750, without the guesswork of mismatched expectations. Cross-state movers gain confidence knowing their income aligns with vibrant, value-packed neighborhoods. Explore settlesavvy.ai today for personalized Iowa recommendations and transform your relocation into a straightforward, empowered journey.
Conclusion
In 2026, Iowa’s average household income reflects a resilient economy shaped by agriculture, manufacturing, and emerging tech sectors, with statewide figures projected to outpace inflation. Regional breakdowns reveal stark contrasts, from Des Moines’ urban prosperity to rural counties’ steady gains. Key drivers include wage growth, policy reforms, and national comparisons that position Iowa favorably against neighbors like Illinois and national averages.
This data-driven guide empowers families, job seekers, and potential movers with clear, actionable insights to navigate the Hawkeye State’s financial landscape. Use these benchmarks to refine your budget, explore opportunities, or plan your next step. Share your Iowa income story in the comments below, and subscribe for more Midwest economic updates. Armed with this knowledge, seize Iowa’s potential and build a brighter financial future today.