What makes Miami different?
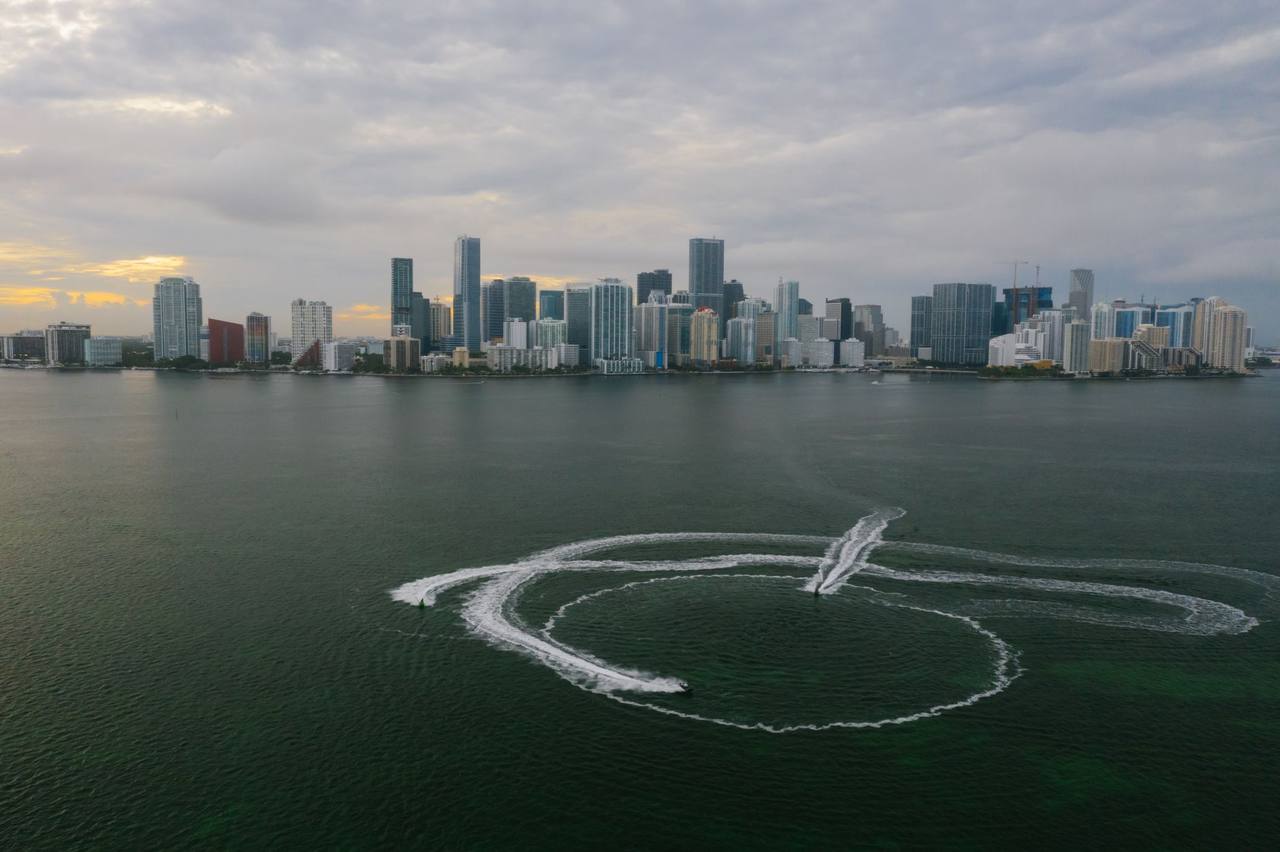
Both the people and the money that transformed the metro came from outside. Cuban, Caribbean, and other Latin American immigrants played key roles, as did Jewish families from the Northeast. Communities that often grow large in other big metros remain smaller here; for example, the percentage of Muslim residents is only a quarter of what you would expect in a metro of this size. Over five years, home prices rose faster than in any other metro with over a million residents, up 68 percent, while professional and managerial roles make up a sixth less of the workforce compared to metros of this size. Most jobs are in hotels, hospitals, construction, and the port, not in the hedge funds and wealth managers who moved to Brickell and West Palm Beach after 2020. These firms brought in capital faster than they increased staffing, and many cash buyers earned their wealth elsewhere.
The developed area is a narrow strip between the Atlantic and the Everglades. Miami-Dade has maintained a legal development boundary on its western edge since 1983. Inside this boundary, construction trends upward. Detached single-family houses make up 48 percent of homes, compared to the 61 percent typical for metros this size, and natural vegetation covers only 5 percent of the land, less than half of the usual share. Most open spaces consist of golf courses, drainage canals, and lawns, with wetlands lying beyond the boundary. Density brings transit options: the area ranks seventh out of 918 metros for bus and rail stops within two miles. Only one metro is brighter after dark.
Homeowners insurance costs about 1.7 times more here than in similarly sized metros when measured as a share of home value, marking one of the widest gaps in the US, due to hurricane and storm-surge exposure, reinsurance rates, and claims litigation. For the many owners who don't live in detached houses, the bill comes twice. Inspection and reserve rules Florida enacted after the 2021 Surfside collapse have led condo boards to impose special assessments for deferred structural repairs. Those who budget based on the purchase price alone may find their calculations faulty.
Religion, politics, nightlife, big yards: important to different people, useless in a national index. Tell us which details matter to you and we'll surface them for every Miami, FL neighborhood in a free personal report.
Build my free Miami, FL report
What does it cost to live in Miami?
#868 of 918
▾
The cost of living in Miami-Fort Lauderdale-West Palm Beach is higher than in most U.S. areas, with only 50 out of 918 metros surpassing it. Housing and daily expenses are among the top in the nation. Homes cost about $337 per finished square foot, more than 94 percent of other metros, and renting a median two-bedroom apartment is around $1,995. Costs for groceries, utilities, and services are about seven percent above the national average, higher than 99 percent of other metros. Homeowners insurance costs more relative to home value than in almost any other metro. Despite this, local incomes don’t completely bridge the gap. The median household income is about $97,500, ranking in the top quarter of metros, but less than half of the neighborhoods earn above the national median, while 95 percent charge above the national median price per square foot.
$1,996 /mo
2BR median rent97th pctile of US metros
- Salinas, CA$2,001
- San Luis Obispo, CA$1,997
- Miami, FL$1,996
- Kapaa, HI$1,972
- Naples, FL$1,899
$2,435 /mo
Owner housing cost96th pctile of US metros
- Portland, OR$2,453
- Breckenridge, CO$2,445
- Miami, FL$2,435
- Riverside, CA$2,416
- Worcester, MA$2,403
107 US=100
Everyday prices99th pctile of US metros
- Kapaa, HI107
- Urban Honolulu, HI107
- Miami, FL107
- Los Angeles, CA106
- Corning, NY106
$3.25 /gal
Gasoline29th pctile of US metros
- Okeechobee, FL$3.25
- Arcadia, FL$3.25
- Miami, FL$3.25
- Naples, FL$3.25
- Memphis, TN$3.24
More affordable neighborhoods are priced around $218 per square foot, with two-bedroom rents about $1,460. These areas are located west and south of the coastal job corridor, around places like Homestead and inland Broward and Palm Beach, where commuting downtown can take an hour. Development halts at the Everglades, so there are no farther suburbs. Another way to save is by buying older properties: a 1970s condo might have a low price per square foot but come with high fees and costly assessments due to post-2021 Surfside structural inspections. Prices here are loosely related to schools, safety, and commute times, so giving up the least important factor often means you can afford the rest.
Tell us which things matter most and we'll tell you the Miami, FL neighborhoods where you can find them.
Find the right Miami, FL neighborhood at the right price
Is Miami safe?
#567 of 918
▾
Miami-Fort Lauderdale-West Palm Beach ranks 567th of 918 US metros for safety. SettleSavvy grades every US neighborhood on a letter scale for crime. We use the best available data to build a model of crime location and frequency. You can read more about the grading method here. Violent crime grades land in the bottom tenth of US metros, while property crime ranks above seven in ten. Inside the metro, six in ten neighborhoods surpass the national middle for property crime, but only one in ten does so for violent crime.
C-
Violent crime11th pctile of US metros
- Warren, PAC-
- Fort Dodge, IAC-
- Miami, FLC-
- Niles, MID+
- Hanford, CAD+
B-
Property crime70th pctile of US metros
- Abilene, TXB-
- Ocala, FLB-
- Miami, FLB-
- Warren, PAB-
- Sidney, OHB-
The weakest violent crime grades are found in the north and south ends of Miami-Dade County, including Overtown, Liberty City, and Florida City, plus Lauderhill and Riviera Beach further north. These areas were historically confined to Black residents by Jim Crow-era housing policies. On the western edge of the metro, Weston, Parkland, and Cooper City rank highest. Selecting an address affects property crime risk more than violent crime risk: the top tenth of neighborhoods approaches an A for property crime and only reaches the national middle for violent crime. In Miami, the safest neighborhoods are often just a few blocks from the weakest, so looking only at city names can miss these differences.
Is Miami a good place to raise a family?
#78 of 918
▾
Miami ranks 78th out of 918 U.S. metros for family-friendliness, mostly due to school grades. Every neighborhood scores above the national median, with little variation. This uniformity comes from Florida’s public school system. In Florida, grades apply to entire districts, and in Miami, the search for top districts is simple. Miami-Dade, Broward, and Palm Beach each operate single countywide systems.

1.9
Playgrounds in reach89th pctile of US metros
- Wichita Falls, TX2.0
- Oskaloosa, IA1.9
- Miami, FL1.9
- Bainbridge, GA1.9
- Washington, DC1.9
6%
Under-5 share39th pctile of US metros
- Henderson, KY6%
- Ukiah, CA6%
- Miami, FL6%
- Mount Airy, NC6%
- Daphne, AL6%
13%
School-age share26th pctile of US metros
- Jackson, WY13%
- Iron Mountain, MI13%
- Miami, FL13%
- Ann Arbor, MI13%
- Lewiston, ME13%
The area scores high on family amenities but low on the number of families living there. Playgrounds rank higher than nearly 90 percent of U.S. metros, with about two within two miles of a typical neighborhood. However, a quarter of neighborhoods, mainly on the western edge, have none nearby. Children under 18 make up 19 percent of the population, placing Miami in the bottom third among U.S. metros. This results from declining birth rates, a large retired population, and post-pandemic housing costs that drove out young families. Both Miami-Dade and Broward are closing schools as enrollment decreases. This setup benefits parents who can manage the magnet school application process but poses difficulties for those relying on district boundaries to sort schools.
What is the weather like in Miami?
#437 of 918
▾
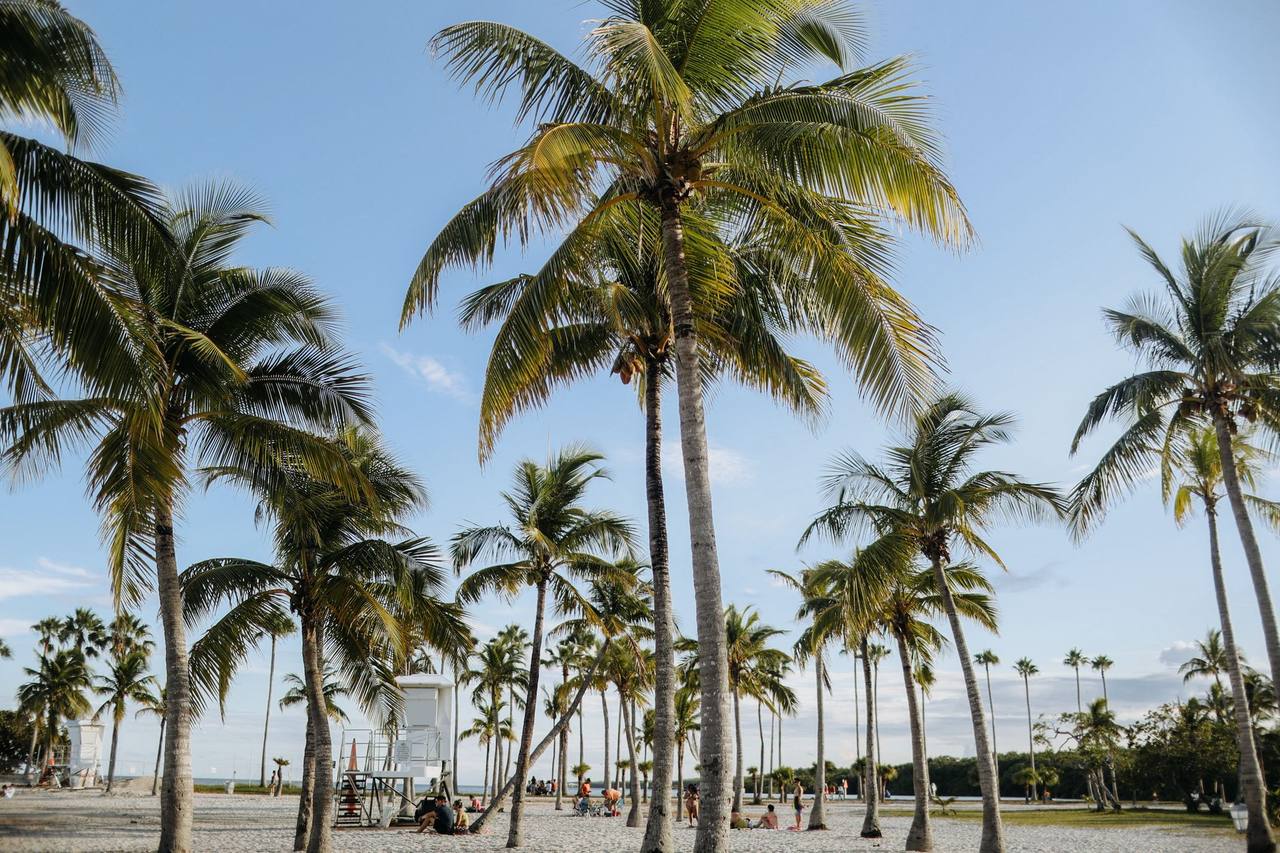
Miami's winter nights average a mild 58 degrees, warmer than in almost any other U.S. metro area. The temperature drops to freezing approximately once every six years. From November to April, the rain generally subsides, and cold fronts help lower the humidity. In summer, temperatures change course, with afternoon highs averaging 91 degrees, moderated by the Atlantic sea breeze. This breeze also triggers almost daily thunderstorms from mid-May through October. In July, Miami's dew point hovers around 74, one of the highest in the country, and it rains more than a third of the year. With 145 pleasant days annually, Miami ranks in the top few percent nationwide, and most of these days occur when much of the country stays indoors.
145 /yr
Pleasant days96th pctile of US metros
- New Orleans, LA147 /yr
- Pottsville, PA147 /yr
- Miami, FL145 /yr
- Beckley, WV145 /yr
- Oshkosh, WI145 /yr
91 °F
Summer high86th pctile of US metros
- Stockton, CA91 °F
- McAlester, OK91 °F
- Miami, FL91 °F
- Dublin, GA91 °F
- Hammond, LA91 °F
58 °F
Winter low100th pctile of US metros
- Key West, FL60 °F
- Miami, FL58 °F
- Naples, FL56 °F
- Cape Coral, FL55 °F
0 in/yr
Snowfall0th pctile of US metros
- Lafayette, LA0 in/yr
- Lake Charles, LA0 in/yr
- Miami, FL0 in/yr
- Tampa, FL0 in/yr
- Orlando, FL0 in/yr
134 /yr
Rainy days82nd pctile of US metros
- Flint, MI134 /yr
- North Wilkesboro, NC134 /yr
- Miami, FL134 /yr
- Augusta, ME133 /yr
- Sandusky, OH133 /yr
82 /yr
Hot days (90°F+)84th pctile of US metros
- Columbus, MS82 /yr
- Gainesville, TX82 /yr
- Miami, FL82 /yr
- Tuscaloosa, AL82 /yr
- Roswell, NM81 /yr
0 /yr
Freezing days0th pctile of US metros
- Naples, FL1 /yr
- Kapaa, HI0 /yr
- Miami, FL0 /yr
- Cape Coral, FL0 /yr
- Key West, FL0 /yr
74 °F
Summer dew point99th pctile of US metros
- Naples, FL74 °F
- Morgan City, LA74 °F
- Miami, FL74 °F
- Houma, LA74 °F
- New Iberia, LA74 °F
The frequency of hurricanes in Miami ranks in the top two percent of U.S. metros, with tornado occurrences not far behind. However, Florida's tornadoes are often minor, resulting from sea-breeze collisions and tropical systems. River flooding poses a below-average risk; instead, flooding usually comes from high tides and heavy downpours. Coastal flood losses rank in the top tenth nationwide due to the area's porous limestone, which allows seawater to rise from below during king tides. Raised roads and seawalls offer limited relief. No winter storms or earthquakes occur. This is why an area with some of the country's most pleasant weather still ranks mid-pack among 918 U.S. metros for risk, and why homeowner policies here include separate windstorm and flood coverage.
What kind of amenities does Miami have?
#32 of 918
▾
Miami-Fort Lauderdale-West Palm Beach is ranked 32nd among 918 US metro areas for amenities, despite being the eighth most populous. More amenities are usually found in denser areas, and this region is no exception, with the Everglades to the west and the Atlantic Ocean to the east forcing six million residents into a narrow coastal area. Within this space, top neighborhoods in Miami offer around 100 restaurants nearby, while the metro median is 25. In contrast, neighborhoods in the bottom tenth have just four.
3.4
Nightlife spots84th pctile of US metros
- Terre Haute, IN3.4
- Chico, CA3.4
- Miami, FL3.4
- Cortland, NY3.3
- Manchester, NH3.3
244.9
Transit stops99th pctile of US metros
- Champaign, IL304.7
- Springfield, IL285.1
- Miami, FL244.9
- Seattle, WA235.4
- Urban Honolulu, HI229.5
10.6
Everyday services82nd pctile of US metros
- Ellensburg, WA10.8
- Keene, NH10.7
- Miami, FL10.6
- Hood River, OR10.6
- Iowa City, IA10.6
2.8
Gyms94th pctile of US metros
- Olympia, WA2.8
- Carson City, NV2.8
- Miami, FL2.8
- Mankato, MN2.8
- Sacramento, CA2.8
Nightlife is concentrated in a few specific areas like South Beach, Wynwood, Brickell, and Las Olas. Most neighborhoods have only one bar within a two-mile radius, and a quarter have none. Retail, however, is abundant, putting the area in the top 3 percent of US metros for retail floor space within reach. This is partly because malls like Aventura, Sawgrass Mills, and Dolphin Mall attract shoppers from Latin America in addition to local residents. Trail availability is more limited. Only about half of the neighborhoods exceed the national median, and the longest trails are located far west on Everglades levees, away from shopping areas. The metro is ideal for someone wanting restaurants and public transport nearby, but not for those looking for easy access to trails from their home.
What's outdoor access like in Miami?
#439 of 918
▾
Miami ranks 439th out of 918 U.S. metro areas for green space, placing it in the middle due to contrasting factors. In an average neighborhood, only about 5 percent of the land consists of natural vegetation like forests, shrubs, or wetlands. This puts Miami in the lowest 3 percent nationwide. However, park access ranks in the top 10 percent. Both outcomes stem from the same constraints: the city is confined between the Atlantic Ocean and the Everglades, and its growth is partly restricted by Miami-Dade's Urban Development Boundary. As a result, Miami is one of the most densely built urban areas, where small parks fit but wild land cannot.

1.6
Parks in reach89th pctile of US metros
- Santa Rosa, CA1.7
- Baltimore, MD1.7
- Miami, FL1.6
- Oklahoma City, OK1.6
- Klamath Falls, OR1.6
47.5 mi
Connected trail miles64th pctile of US metros
- Fort Morgan, CO47.6 mi
- Lake of the Woods, VA47.5 mi
- Miami, FL47.5 mi
- Rio Grande City, TX47.1 mi
- Kingston, NY47.1 mi
Natural landscapes are found outside this boundary, mainly in the Everglades marshes and conservation areas. Within the boundary, most green spaces are cultivated, like lawns, golf courses, and fields around Homestead, none of which count as natural cover. Trail access also varies along this divide: the average neighborhood offers about 13 miles of connected trails, with the top tenth enjoying over 120 miles. This is because the levee greenways hugging the conservation areas run along the western edge through areas like Parkland, Coral Springs, and Weston. Those desiring wooded backyards might need to consider other locations, but a park at the end of the block is a common amenity.
How affluent is Miami?
#305 of 918
▾
Miami-Fort Lauderdale-West Palm Beach ranks 305th out of 918 U.S. metros for affluence, low for the eighth-largest metro area in the country. Education fares better: the share of adults with a bachelor's degree is in the top fifth of metros, and the median household income is nearly $97,500, placing it in the top quarter. This wealth is driven by a wealthy minority of neighborhoods. Neighborhood incomes range from about $52,000 in the lowest tenth to $167,000 in the highest. Fewer than half of the neighborhoods exceed the national median income.
39%
White-collar jobs72nd pctile of US metros
- Wichita, KS39%
- Ketchikan, AK39%
- Miami, FL39%
- Tulsa, OK39%
- Deltona, FL39%
22%
Bachelor's (men)83rd pctile of US metros
- Tampa, FL22%
- Juneau, AK22%
- Miami, FL22%
- Auburn, AL22%
- Marshall, MN21%
23%
Bachelor's (women)83rd pctile of US metros
- Oak Harbor, WA23%
- Spirit Lake, IA23%
- Miami, FL23%
- Marshall, MN23%
- Bloomington, IN23%
Considering income against monthly housing costs, the metro ranks in the bottom two percent of U.S. metros, and median rent is among the nation’s highest. Households in South Florida are larger than the national average and include more earners, so one worker's pay is well below what the household income suggests. Service jobs rank in the top quarter of metros, while trades and manual jobs fall in the bottom eighth, offering few middle-wage opportunities for workers without a degree. Miami favors those who bring established income from elsewhere, such as finance professionals who moved south after 2020, while those earning local wages face more challenges.
What is the Miami community like?
#863 of 918
▾
Miami ranks 863rd out of 918 U.S. metros for community stability, mainly due to low homeownership rates. About 62% of homes are owner-occupied, lower than in 90% of other metros. Despite this, people tend to stay in their homes. The typical householder has lived in their home for ten years, slightly below the national average, and fewer residents moved last year than in most other metros. Homeownership varies widely by neighborhood, ranging from one in four homes to nine in ten.
62%
Owner-occupied10th pctile of US metros
- Memphis, TN62%
- Iowa City, IA62%
- Miami, FL62%
- Tifton, GA61%
- Greenwood, MS61%
53%
Coupled households34th pctile of US metros
- Lake Havasu City, AZ53%
- Waco, TX53%
- Miami, FL53%
- Winston, NC53%
- Uvalde, TX53%
40%
Divorced (of ever-married)75th pctile of US metros
- Beeville, TX40%
- Virginia Beach, VA40%
- Miami, FL40%
- Brownsville, TX40%
- Kingston, NY40%
Less than half of Miami's homes are single-family detached. This is due to limited buildable land, hemmed in by the Everglades and the ocean, leading Miami to build more condo towers. Many new condos are bought by international investors who rent them out. Local wages haven't kept up with Miami's rising cost of living, so households that would own in other metros rent here for years. Among ever-married residents, the divorce rate is higher than in three-quarters of U.S. metros. This is partly because Broward and Palm Beach attract retirees, and divorces accumulate over time. For those earning a local salary, buying a detached house is a challenge in Miami's tight market.
Who lives in Miami?
▾
The Miami-Fort Lauderdale-West Palm Beach area scores about 44 out of 100 on the racial and ethnic diversity index, indicating a greater representation of the eight Census race and ethnicity groups than in most U.S. metros. However, diversity varies across neighborhoods. The least diverse areas score around 15, resembling a single group, while the most diverse areas score above 60.
50%
Democratic vote, 202483rd pctile of US metros
- Dover, DE50%
- Des Moines, IA50%
- Miami, FL50%
- Orlando, FL50%
- Lincoln, NE50%
49%
Republican vote, 202418th pctile of US metros
- Columbia, SC49%
- Easton, MD49%
- Miami, FL49%
- Stockton, CA49%
- Orlando, FL49%
44%
Turnout, 202438th pctile of US metros
- Gallipolis, OH44%
- Monticello, NY44%
- Miami, FL44%
- St. Joseph, MO44%
- San Francisco, CA44%
46%
Religious adherents47th pctile of US metros
- Santa Maria, CA46%
- Decatur, IL46%
- Miami, FL46%
- Wooster, OH46%
- Louisville/Jefferson County, KY46%
24%
Catholic86th pctile of US metros
- Winona, MN24%
- Barnstable Town, MA24%
- Miami, FL24%
- Santa Rosa, CA23%
- Pottsville, PA23%
14%
Evangelical Protestant35th pctile of US metros
- Grand Rapids, MN14%
- Kalamazoo, MI14%
- Miami, FL14%
- Cumberland, MD14%
- Laurinburg, NC14%
0.7%
Jewish99th pctile of US metros
- Philadelphia, PA0.7%
- Ithaca, NY0.7%
- Miami, FL0.7%
- Boston, MA0.6%
- Washington, DC0.6%
1.6%
Mainline Protestant9th pctile of US metros
- Eureka, CA1.7%
- Santa Maria, CA1.6%
- Miami, FL1.6%
- Oxnard, CA1.6%
- San Luis Obispo, CA1.6%
In the 2024 presidential election, the vote was nearly split, with 50 percent supporting the Democratic ticket and 49 percent backing the Republicans. This close result reflects the contrasting trends in different counties. Miami-Dade shifted towards the Republican ticket after years of Democratic preference, whereas Broward County remained loyal to the Democrats. Voter turnout, when measured against the total population rather than just registered voters, was below the average for U.S. metros. This is partly because many residents are not U.S. citizens, thus ineligible to vote. Religious participation sees about 46 percent of residents affiliated with a congregation, a mid-level figure compared to other U.S. metros. Catholic parishes have a more significant share of the population than nearly all but one other metro, influenced by migration from Cuba, Haiti, and other Latin American countries. The Catholic archdiocese conducts Mass in over a dozen languages. Additionally, the area's synagogue membership rate is among the highest in the country.
Where are the best places to live in Miami?
We evaluated every town and community in Miami-Fort Lauderdale-West Palm Beach on factors like safety, cost, schools, jobs, and parks. Then, we paired each place with the type of mover it suits best.
Best for relocating retirees: Tamiami
Tamiami has the highest homeownership rate and longest tenure compared to any community around Miami. In a metro area ranked 863rd out of 918 nationally for stability, Tamiami stands out. Nearby parks and a lower crime rate make this community unique in a region where condo towers have dominated much of the growth. Parkland and The Hammocks run close behind.
Best for military families on new orders: Coral Springs
Coral Springs is the top choice for families in the Miami area, also excelling in crime safety rankings within the metro. A family can conveniently choose both a school and a neighborhood around the western edge near the levee trails in a single decision. Lauderhill and Davie run close behind.
Best for a fresh start: Plantation
Of the communities near Miami, only seven have more restaurants, stores, and bus stops than Plantation. The area also enjoys one of the best crime rates in the metro. This makes starting fresh easier, with short errands and a safe environment. However, these conveniences come with a higher cost compared to the more affordable areas west and south of the coastal job corridor. The Hammocks and Tamarac run close behind.
Best for young professionals: Miami
Miami ranks highest in the area for both job opportunities and nightlife, with popular bars located in Brickell, Wynwood, and South Beach. However, it also ranks lowest for safety, with crime rates varying significantly even within short distances. It's important to consider each address individually when assessing safety. Kendall and Miami Beach run close behind.
Best for grad school and med programs: Lauderhill
Living expenses in Lauderhill are the lowest in the Miami area, making it a sensible choice for those on a stipend. This is important where the median rent for a two-bedroom is about $1,995. However, violent crime rates are among the highest here, so the specific block matters more than just the city's name. Tamarac and Plantation run close behind.
Best for mid-career moves: Parkland
Parkland has the highest household incomes in the Miami area, but it ranks low in job access. This suggests that residents either commute long distances for work or earn their income from outside the metro area. The community excels in areas like schools, parks, and low crime rates, but it falls short when it comes to shopping and dining options. Weston and Miami run close behind.
Best for you: my map
No two moves weigh these things the same way. Schools first or price first, quiet streets or a walkable night out, everyone is looking for something different. Tell us what matters most to you and we'll build your own Miami map together, every neighborhood scored to your priorities.
Every neighborhood in Miami, FL, mapped and scored on the factors you pick. Start from our defaults, then tune the weights until the map shows where you belong.
Open the Miami, FL neighborhood map