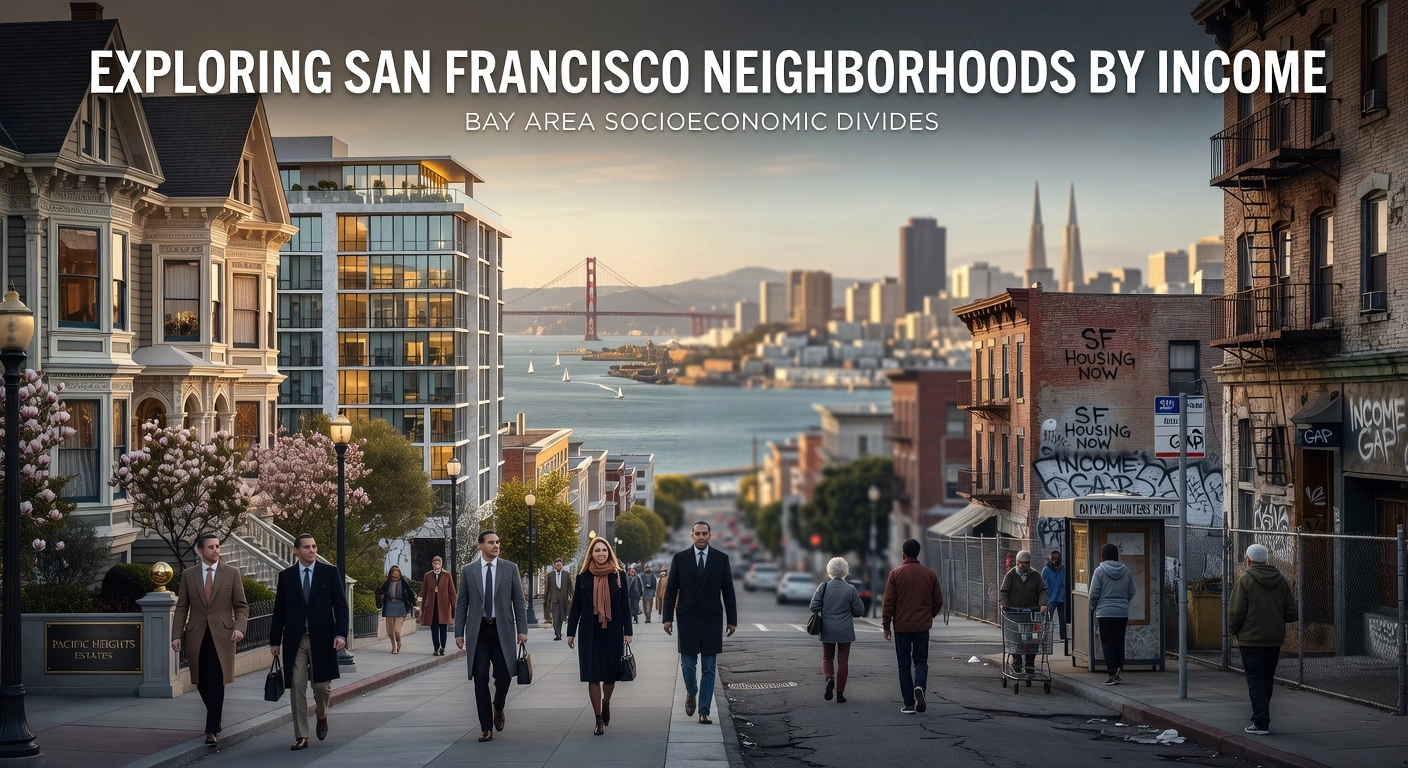
Exploring San Francisco Neighborhoods by Income
San Francisco captivates with its iconic fog-shrouded hills, bustling tech hubs, and eclectic mix of cultures. Yet beneath this allure lies a tale of economic extremes that shape daily life. From multimillion-dollar mansions to affordable artist enclaves, the city’s neighborhoods reflect profound income disparities. If you are new to the Bay Area, understanding san francisco neighborhoods by income offers a clear lens to navigate housing choices, community vibes, and urban trends.
This analysis breaks down the data simply and authoritatively. You will discover the wealthiest enclaves like Pacific Heights and Presidio Heights, where median household incomes soar above $200,000. Contrast those with more modest areas such as Bayview-Hunters Point, where incomes hover around $60,000. We examine key factors driving these differences, including tech booms, historic gentrification, and proximity to job centers. Expect insights into how income levels influence rent prices, school quality, and local amenities.
By the end, you will gain the knowledge to explore San Francisco confidently. Whether you dream of Silicon Valley proximity or seek hidden gems, this guide equips beginners with essential facts for informed decisions.
San Francisco Citywide Income Overview
San Francisco stands out as one of America’s wealthiest cities, with a median household income that reflects its status as a tech powerhouse. According to the latest 2020-2024 American Community Survey (ACS) data from U.S. Census QuickFacts, this figure ranges from $139,801 to $140,970, roughly double the national U.S. average of about $81,000. This affluence stems largely from the tech sector, where high-paying roles in software engineering and executive positions dominate, accounting for over 40% of employment. For cross-state movers relocating from lower-cost areas like the Midwest or South, this citywide benchmark signals a significant lifestyle upgrade but also potential sticker shock in housing and daily expenses. Understanding these numbers early helps you align your budget with realistic neighborhood choices, avoiding overextension in high-cost zones.
Per capita income further underscores this concentration of wealth, clocking in at $92,289 citywide, well above the U.S. average of around $41,000. This metric reveals how gains accrue disproportionately to high earners, such as tech professionals pulling six-figure salaries, while many residents scrape by. Citywide poverty remains at about 11.2%, stable yet persistent, with pockets exceeding 30% in denser urban areas. About 14% of households earn under $25,000 annually, contrasted by 48% above $150,000. Cross-state movers should factor this disparity into their search: if your household income falls below the median, prioritize neighborhoods with balanced amenities and lower entry costs to ease the transition.
Racial income gaps add another layer of complexity, rooted in historical inequities and ongoing market dynamics. Data from the 2022 San Francisco Planning equity analysis shows White households at a median of $176,815, Asian households at $135,331, and Black households at $84,662. Recent ACS updates align closely, with White incomes near $177,000 and Black around $52,000 in some estimates, highlighting slower growth for marginalized groups. These divides influence neighborhood demographics and community vibes, so movers from diverse backgrounds can use them to seek inclusive areas that match their earning potential and cultural fit.
The broader San Francisco metro area median, spanning $135,590 to $136,000 per recent ACS reports like those from MTC Vital Signs, reinforces regional prosperity but amplifies affordability strains. Incomers from states with medians under $70,000 often face rent burdens over 50% of income. Actionable tip: Compare your pre-move earnings to these figures using tools like Census Reporter; aim for neighborhoods where local medians align within 20% of yours to simplify budgeting and integration. This citywide lens sets the stage for exploring specific San Francisco neighborhoods by income, guiding your ideal match.
High-Income Northwest Neighborhoods
San Francisco’s northwest neighborhoods represent the pinnacle of high-income living, where median household incomes far surpass the citywide average of about $141,000. These areas, including Sea Cliff, Pacific Heights, Presidio Heights, and the Marina District, draw affluent professionals and families from across the country, particularly those in tech and finance. For cross-state movers, their blend of luxury amenities, scenic views, and strategic location near major highways like US-101 simplifies the relocation process. Residents enjoy unparalleled access to the Presidio’s trails, Golden Gate Bridge vistas, and quick commutes to downtown tech hubs, making settlement seamless even for newcomers unfamiliar with the Bay Area.
Sea Cliff: Elite Estates with Iconic Views
Sea Cliff tops the list among San Francisco neighborhoods by income, boasting a median household income of $236,000 according to 2024 Reddit visualizations derived from recent Census data. This exclusive enclave features sprawling family estates perched on cliffs overlooking the Pacific Ocean and Golden Gate Bridge, offering privacy through private streets and low density. High earners relocating here benefit from spacious 5,000-plus square foot homes ideal for families, with median values around $3.5 million to $4.4 million. Note that some analyses, like Homesnacks’ 2025 ACS review, report lower figures around $134,000 due to retirees living off investments rather than wages, underscoring the area’s hidden wealth. For movers, the neighborhood’s serene vibe and proximity to Baker Beach provide an immediate sense of prestige and relaxation. Actionable tip: Prioritize oceanfront properties if budget allows, as they hold value amid rising AI-driven demand.
Pacific Heights and Presidio Heights: Historic Prestige Meets Tech Proximity
Pacific Heights follows closely with a median household income of $172,749, while neighboring Presidio Heights clocks in at $169,878, per the same Homesnacks 2025 ACS analysis. These areas showcase Gilded Age mansions, private schools, and parks like Lafayette Square, appealing to executives who value walkability and status. Median home prices exceed $4.9 million in Pacific Heights and $5 million in Presidio Heights, reflecting their status as family havens just minutes from SoMa’s tech epicenters via highways 101 and 280. Relocators appreciate the short 5- to 10-minute drives to offices, easing the transition from out-of-state commutes. Market data shows high competitiveness, with homes selling 8% over list price in under two weeks. Beginners should budget for premium maintenance on these historic properties while leveraging nearby amenities for instant community integration.
Marina District: Dynamic Waterfront Appeal for Young Professionals
The Marina District shines with a median household income of $174,122, attracting vibrant young professionals to its waterfront condos and apartments along Chestnut Street. Crissy Field, yacht clubs, and bay views create a lively yet upscale atmosphere, enhanced by top-tier walkability scores over 90. Home values average $2.5 million, with quick sales in a market up 6% year-over-year. Cross-state movers find highway access effortless, supporting stress-free logistics from arrival to settling in. The younger demographic and renter-friendly options make it adaptable for those testing Bay Area life.
Across these northwest enclaves, home values average 10 times the national median of roughly $412,000, signaling premium lifestyles fueled by tech wealth. Yet, San Francisco’s cost-of-living index near 239 demands budget adjustments, ideally $500,000-plus annual income for affordability. For relocators, focus on total wealth metrics and consult updated ACS data like Census quickfacts to align finances. These neighborhoods streamline moves through superior infrastructure, positioning high earners for long-term success.
Affluent Central and Southwest Neighborhoods
San Francisco’s central and southwest neighborhoods offer a compelling blend of affluence and livability for cross-state movers seeking stability in high-income areas. These districts, including Noe Valley, Potrero Hill, Glen Park, and Twin Peaks, feature median household incomes well above the citywide average of $140,970, according to 2020-2024 American Community Survey data. This clustering of wealth provides families and professionals with family-oriented environments, green spaces, and convenient access to tech corridors, all while easing the relocation process through lower density and practical amenities. For out-of-state movers, these areas stand out by minimizing common urban hassles like tight parking and overwhelming crowds, allowing a smoother transition into Bay Area life. Recent analyses highlight their resilience amid income inequality trends, with households here often exceeding $170,000 annually, driven by tech executives and remote workers.
Noe Valley: Family Haven at the Top
Noe Valley leads San Francisco neighborhoods by income, boasting a median household income of $185,103 per HomeSnacks’ 2025 rankings based on Census data, topping the city’s richest lists. Recent estimates from Point2Homes peg it even higher at $199,211 median and $268,829 average for 2019-2023 ACS data, about 42% above city norms. Its tree-lined streets, Douglass Park, and top schools like Noe Valley Montessori make it perfect for movers with children, where over 43% of households include families and 11.8% of residents are under 15. Median home prices around $2.15 million reflect this stable demographic, but walkable 24th Street shops and cafes add daily convenience. For cross-state relocators, the neighborhood’s calm vibe reduces unpacking stress, with community events fostering quick social integration.
Potrero Hill: Views, Commutes, and Logistics Ease
Potrero Hill ranks second with a $180,007 median household income, per the same HomeSnacks analysis, supported by Niche.com figures near $205,867. Hilltop bay views, 15-minute tech commutes (39% drive, 28% walk), and vibrant community gatherings draw high earners, with 58% of households over $200,000. Ample street parking accommodates out-of-state moving trucks, a rare boon in denser areas, while over 80% of adults hold bachelor’s degrees or higher. Median homes exceed $1.7 million, yet the area’s breweries and parks like Anchor Brewing site enhance work-life balance. Movers benefit from this setup, as shorter drives to offices like Dogpatch tech hubs cut post-move fatigue.
Glen Park and Twin Peaks: Serene Southwest Retreats
Glen Park and Twin Peaks in the southwest provide quieter escapes with incomes surpassing city averages: Glen Park at $169,820 and Twin Peaks at $159,190 (HomeSnacks 2025). Point2Homes data shows Twin Peaks’ median at $201,672 and average $269,888, ideal for remote workers craving green spaces like Glen Canyon Park and panoramic vistas. Lower density means more single-family homes around $1.8-2 million, fostering peace post-relocation. These spots suit balanced lifestyles, with family vibes and low poverty rates (around 12% in similar areas).
Walkable amenities across these neighborhoods, from Noe Valley’s cafes to Potrero’s views, slash moving stress compared to downtown high-rises. High car ownership (70%+) aids truck access, while stable demographics ensure long-term value. For cross-state movers, prioritizing these high-income havens streamlines settling in, backed by SF Chronicle insights on enduring appeal amid 2024-2026 tech recovery.
Lower-Income Northeast and Southeast Neighborhoods
In contrast to the affluent northwest and central-southwest enclaves, San Francisco’s northeast and southeast neighborhoods reveal the city’s stark income disparities, with median household incomes often dipping below $50,000, far under the citywide $140,000 benchmark from 2020-2024 ACS data. These areas, including Chinatown, Tenderloin, and Bayview-Hunters Point, embody dense urban vitality and cultural depth but grapple with poverty rates of 20-50 percent, driven by historical factors like immigration, industrial legacies, and gentrification pressures. For cross-state movers eyeing budget-friendly options, these districts offer relative affordability in a high-cost market, though they demand careful planning around logistics and long-term stability. Data from sources like U.S. Census QuickFacts for San Francisco underscores the divide, showing per capita incomes as low as $36,000 in cores versus $92,000 citywide.
Chinatown
Chinatown holds the unenviable record as one of San Francisco’s lowest-income neighborhoods, with a median household income of $37,799 according to Homesnacks analysis of pre-2020 ACS data. This dense urban core, home to about 15,000-20,000 residents packed into a compact area, pulses with cultural richness through bustling markets, historic architecture, and festivals like Lunar New Year. Yet poverty rates climb to 30 percent or higher, with over 50 percent of households below 200 percent of the federal poverty level, exacerbated by high rent burdens exceeding 50 percent of income. Recent PUMA data blending Chinatown with adjacent areas reports $76,796, but granular estimates confirm the core lags at $17,000-$28,000 medians. Cross-state movers drawn to its vibrancy should prioritize community resources like the Chinatown Community Development Center for affordable housing leads, easing integration despite narrow streets.
Tenderloin
Adjacent to Chinatown, the Tenderloin registers around $43,000 in median household income based on 2020 SF Chronicle reporting, with updated estimates from $23,000-$32,000 reflecting post-pandemic stagnation. This 50-block hub suits budget-conscious singles, boasting some of the city’s cheapest rentals at $800-$1,200 monthly for single-room occupancy units amid America’s highest urban density. Challenges abound, including 26-51 percent poverty, visible homelessness, and elevated unemployment near 20-30 percent, yet assets like Glide Memorial Church provide food pantries and support services. For newcomers stretching cross-state salaries around $100,000, these low rents free up funds for savings, but expect hurdles like open-air issues and limited privacy. Actionable tip: Scout via Muni-accessible walks and connect with local arts groups for social ties.
Bayview-Hunters Point
In the southeast, Bayview-Hunters Point contrasts citywide wealth with medians from $43,000-$80,000 and poverty at 26-39 percent, per SF Planning’s 2025 Racial and Social Equity Analysis and PUMA data. Once industrial, it faces displacement risks from shipyard redevelopments pushing rents up 30 percent, displacing long-term Black residents amid health concerns from superfund sites. Still, yards and parking ease moves compared to denser north, with T-Third rail improving commutes. Movers benefit from orgs like Bayview Hunters Point Multipurpose Senior Services for stability aids.
Cross-state relocators should weigh denser northside parking woes (permits $300+ yearly) against southeast space, leveraging DataUSA profiles for trends. Community hubs smooth transitions, stretching salaries further while building resilience against inequality.
Geographic Income Clusters and Visual Maps
San Francisco’s neighborhoods form distinct geographic income clusters, vividly illustrated through interactive maps that make analyzing San Francisco neighborhoods by income straightforward for cross-state movers. Northwest enclaves such as Sea Cliff and Marina emerge as high-income hubs on BestNeighborhood.org’s interactive map, where green-coded zones signal median household incomes exceeding $200,000; for instance, Sea Cliff reaches $236,000, and Marina hits $211,854 based on recent zip-code data approximating these areas. Central hills like Noe Valley and Potrero Hill closely follow, with medians of $196,571 and $180,007 respectively, transitioning from yellow to green shades that highlight their affluence. These visualizations, drawn from 2020-2024 American Community Survey data, reveal how topography and proximity to the ocean or tech corridors concentrate wealth. For movers, such maps simplify scouting by overlaying income with home values often 10 times the national median.
In stark contrast, the northeast and southeast quadrants, including Tenderloin, Chinatown, and Bayview-Hunters Point, concentrate lower incomes as shown in the San Francisco Chronicle’s demographic maps. These areas appear in red, with Chinatown at a median of $37,799, Tenderloin around $43,000, and Bayview facing poverty rates near 30 percent, far above the citywide 11 percent. Chronicle visualizations using Planning Department boundaries confirm persistent low-earner dominance, where fewer than 10 percent of households exceed $200,000 annually. Dense urban fabrics and service-sector jobs underpin these patterns, even as citywide medians climb to $140,970. Movers can use these maps to avoid mismatched expectations, focusing instead on balanced options.
Interactive Tools to Streamline Your Move
Elevate your planning with tools like the Mission Local 2025 Neighborhood Dashboard, launched in June 2025, which lets users toggle income layers over housing costs, transit scores, and commute times via intuitive dropdowns. Select Noe Valley to see its walkability paired with $185,103 medians and quick BART access, or compare Bayview’s transit-rich blocks against lower incomes for realistic budgeting. BestNeighborhood.org complements this with hover details on $128,823 city averages, while Chronicle maps layer seven demographics for school district insights. These free resources, powered by 2023-2024 ACS data, empower beginners to customize searches, aligning income levels with family needs or remote work flexibility.
Patterns That Guide Neighborhood Choices
High-income clusters in northwest and central hills denote walkable family zones, boasting top SFUSD schools via lotteries and 20-minute downtown commutes, ideal for cross-state families prioritizing stability. Urban cores in the northeast and southeast offer dense, transit-heavy living but longer suburb treks and variable school metrics. Dashboards reveal these divides, helping visualize how Glen Park’s affluence supports parks and playgrounds versus Chinatown’s vibrant but compact energy. For movers, this clarity cuts research time, matching budgets to lifestyles amid SF’s inequality.
Key Income Trends and Gentrification Impacts
San Francisco’s income dynamics reveal critical trends that cross-state movers must navigate when evaluating San Francisco neighborhoods by income. While the citywide median household income sits at approximately $141,000, the broader metro area climbed to $136,000 by 2024, according to recent American Community Survey data. This growth, however, skews heavily toward high earners, with the 90th percentile surging far faster than lower brackets, widening the 90/10 income ratio to 16.7 times. Middle-income households, often earning between $60,000 and $100,000 regionally, face heightened displacement as luxury developments upgrade neighborhoods. Urban Displacement Project maps underscore this vulnerability, showing how tech-driven booms push families out of stable housing. For movers, this means prioritizing neighborhoods with balanced growth to avoid future rent hikes or evictions.
Skewed Growth and Middle-Income Displacement
Income gains in San Francisco favor top earners, exacerbating pressures on middle-class residents. The metro area’s rebound to $136,000 reflects a 4.3 percent increase since 2021, yet low- and middle-income groups bear the brunt of housing cost escalation. Urban Displacement maps indicate that middle-income tracts are prime targets for “super-gentrification,” where influxes of high-wage tech workers transform communities. This displacement affects about 161,000 low-income households citywide, many relocating to outer suburbs. Movers from affordable states should use cost-of-living (COL) calculators to benchmark their salary; for instance, a $100,000 Midwest income equates to roughly $200,000 in San Francisco purchasing power after adjustments. Actionable step: Review UDP interactive maps to identify stable zones before committing to a lease.
Gentrification Pressures in Vulnerable Areas
Roughly 18.5 percent of San Francisco’s census tracts are at risk of or undergoing gentrification, per Urban Displacement analyses. Neighborhoods like the Mission District and SoMa exemplify this, where luxury condos and tech offices displace low-income residents amid booming developments. In the Mission, historically Latino communities face eviction threats despite anti-displacement programs preserving affordable units. SoMa’s mix of high median incomes over $250,000 in parts and subsidized housing creates tension, with lawsuits highlighting poverty concentrations. These shifts pressure service workers and families below 80 percent of area median income ($186,600 for a family of four in 2025). For cross-state movers, scout for “at-risk” labels on displacement maps to ensure long-term affordability.
Wealth Mismatches in Retiree Enclaves
Retiree-heavy neighborhoods like Sea Cliff distort income perceptions, with medians exceeding $236,000 yet many households relying on pensions of $30,000 to $70,000. These areas’ true wealth stems from asset values, such as homes bought decades ago now worth $10 million plus. This mismatch understates affordability barriers for newcomers, as high property taxes and maintenance costs persist. Movers should look beyond median incomes to home equity data for realistic budgeting.
Remote Work Value in Outer Southwest
Remote work trends elevate outer southwest areas like the Sunset District, where medians around $100,000 to $120,000 offer better value than core zones. With 45 percent of Bay Area jobs remote-eligible, demand shifts to spacious, family-friendly spots 30 to 40 percent below citywide housing medians. Midwest transplants benefit most, stretching budgets via COL tools from sources like NerdWallet. San Francisco’s chief economist notes AI and remote patterns fueling this outward migration. Target these for stability, using income maps to compare lifestyle fits.
Understanding these trends equips movers to select resilient neighborhoods amid ongoing shifts.
Income Insights for Cross-State Movers
Adjusting Out-of-State Salaries with Cost-of-Living Tools
Cross-state movers often overlook how San Francisco’s sky-high cost of living alters purchasing power, especially when analyzing San Francisco neighborhoods by income. Start by using free cost-of-living (COL) calculators from sites like NerdWallet or Salary.com to convert your current salary. For instance, a $120,000 household income from Texas, where the national median home price sits around $400,000, equates to roughly $210,000 to $250,000 in San Francisco to sustain a similar lifestyle, accounting for 70-80% higher overall costs dominated by housing. In mid-range Potrero Hill, with a median household income of $180,007, this adjusted salary stretches further, covering a 2-bedroom rental around $4,600 monthly while leaving room for savings. Contrast this with ultra-high Sea Cliff, where medians exceed $200,000 and rents top $6,000, demanding far more financial firepower and often pricing out all but top earners. Beginners should input family size, taxes, and remote work status into these tools for precise estimates, easing the transition to neighborhoods that align with your budget.
Factoring Moving Logistics into Neighborhood Choices
Moving trucks face unique hurdles in San Francisco due to steep hills, narrow streets, and strict parking rules, making logistics a key consideration alongside income data. Secure temporary no-parking signage through SFMTA at least five business days in advance, costing $340 to $1,200 based on signs needed. Family-oriented areas like Noe Valley offer easier access with wider residential streets and residential permit parking zones, typically requiring just 5-10 signs for a smooth unload. Dense cores such as Chinatown, however, complicate matters with narrow alleys, high foot traffic, and commercial restrictions, often needing 15+ signs and early morning timing to avoid delays. Potrero Hill strikes a balance for mid-income families, with port-adjacent spots allowing better truck maneuvering despite some hill challenges. Plan two weeks ahead and budget $400-900 extra to prevent costly surprises, ensuring your move to a high-value neighborhood starts stress-free.
Pairing Income Data with Schools, Safety, and Parks
Income alone paints an incomplete picture; integrate it with lifestyle factors using platforms like SettleSavvy.ai for seamless matching. This tool filters San Francisco neighborhoods by income against family size, remote work needs, top-rated schools via GreatSchools ratings, safety stats, and park proximity. Noe Valley shines for families with A-grade schools, low crime rates under 5%, and walkable spots like Noe Valley Park, pairing well with its $185,103 median income. Potrero Hill complements remote workers with reliable fiber internet and green spaces, while avoiding Chinatown’s higher poverty and density. Input your adjusted salary and priorities to generate affordability scores, revealing hidden gems like Bernal Heights for balanced budgets. This approach simplifies decisions, matching your profile to neighborhoods that support long-term happiness and productivity.
Housing Budgets and Gentrification Risks
High-income enclaves like Sea Cliff and Pacific Heights require 2-3 times the national housing budget, with median homes over $4 million and rents demanding 35-43% of income. Mid-tier spots such as Potrero Hill ease this at $2.2 million medians and $4,591 2-bedroom rents, fitting $180,000 earners better. Lower-income areas like Chinatown offer entry-level rentals around $3,000 but carry gentrification risks, where rents have risen 13% yearly and displacement threatens stability. Watch trends in Bayview or Mission, where low-income households face ongoing pressures from tech influx. Use income maps and tools to prioritize value-retaining hoods, securing rentals now while eyeing long-term buys. For cross-state movers, this strategy maximizes affordability and minimizes future upheaval in San Francisco’s dynamic landscape.
Matching Your Budget to SF Neighborhoods
$150K+ Households: Prioritize Northwest and Central Hills
Households earning $150,000 or more should target San Francisco’s northwest neighborhoods like Sea Cliff, with median incomes exceeding $236,000, and central hills such as Pacific Heights ($172,749 median) and Presidio Heights ($169,878). These areas deliver prestige through historic mansions, waterfront views, and elite amenities including yacht clubs, top-rated schools, and proximity to tech hubs. Data from 2023-2024 ACS shows 57-63% of residents here earn over $200,000, supporting luxury rents of $3,100-$4,200 for 1-2 bedrooms. For cross-state movers, income-aligned quizzes on platforms like BestNeighborhood.org help confirm fit by matching lifestyle preferences to these high-end enclaves. Actionable insight: Factor in $400,000+ qualifying income for $3 million+ homes to avoid overextension. This strategic focus simplifies relocation by aligning prestige with long-term stability.
Under $100K Budgets: Northeast Rentals with Cultural Perks
For budgets under $100,000, northeast neighborhoods like Chinatown ($37,799 median) and Tenderloin ($43,000) offer affordable rentals at $2,200-$2,900 for studios, blending cultural vibrancy such as dim sum festivals and historic theaters. These dense urban spots provide shared housing options dropping costs to $1,500 per person, ideal for singles or roommates amid 20%+ poverty rates. However, prepare for cost-of-living shock, as San Francisco’s 64% premium over national averages hits groceries and utilities hardest. Integration tips include joining Meetup groups for community events, utilizing food banks via Chinatown CDC, and leveraging Muni transit to cut car expenses. Cross-state movers can thrive by budgeting 50% of income on housing and exploring outer alternatives like Excelsior for safer vibes at similar rents. This approach eases the transition while maximizing cultural perks.
Mid-Range $100K-$150K: Southwest Balances Like Glen Park
Mid-range earners ($100,000-$150,000) excel in southwest areas such as Glen Park (~$120,000-$140,000 median), Noe Valley ($185,103), and Potrero Hill ($180,007), where rents range $2,900-$3,800 balance green spaces like Glen Canyon Park with tech commutes via BART. These family-oriented spots feature top schools, hiking trails, and 20-30 minute access to SFO or Uber hubs, with home prices at $1.5-$2 million requiring $250,000+ income. 2024-2025 trends highlight their boom for remote workers seeking affordability without downtown chaos. For movers, prioritize these for cost-green-tech equilibrium, using family size in budget calculators to qualify for 2BR units. Practical step: Visit during weekends to test walkability and park access.
Leverage SettleSavvy.ai’s neighborhood finder by inputting your income, family details, and preferences for personalized shortlists of San Francisco neighborhoods by income. It generates tailored recommendations with moving cost estimates ($5,000-$15,000 local), streamlining cross-state relocations and minimizing COL surprises. This tool adds immense value, turning complex data into actionable moves.
Actionable Takeaways for Your SF Move
Map Your Budget to Income Clusters
Align your household income with San Francisco’s geographic clusters to streamline your neighborhood selection. High earners targeting luxury should focus on the northwest, where areas like Sea Cliff boast median household incomes around $236,000 and Pacific Heights near $173,000, per recent ACS estimates projecting into 2026 trends. Families with solid six-figure salaries find ideal fits in central hills neighborhoods such as Noe Valley at $185,000 and Potrero Hill at $180,000, offering walkable schools and parks. For affordability, southeast spots like Bayview provide entry points with medians under $70,000 in some tracts, balancing lower rents against urban vibrancy. Use 2020-2024 ACS data as a baseline, noting citywide medians near $140,000, to project 2026 stability amid tech-driven growth.
Simulate Fits with Cost-of-Living Tools
Cross-state movers must adjust out-of-state salaries for San Francisco’s elevated costs. Run calculations at SettleSavvy.ai’s quiz tools to test scenarios, like whether a Midwest $100,000 income sustains Noe Valley living, where housing eats 40-50% of take-home pay. These AI-powered simulators factor per capita incomes around $92,000 citywide and neighborhood variances, revealing if central family areas remain viable post-relocation taxes and expenses. Beginners benefit from instant feedback, avoiding sticker shock in high northwest luxury zones.
Navigate Gentrification and Logistics
Scrutinize SF Planning reports for gentrification trends, prioritizing stable central and southwest areas to minimize displacement risks affecting 18% of tracts. Opt for mover-friendly neighborhoods with ample street parking and Muni transit, such as Potrero Hill or Glen Park, easing truck access during cross-state hauls. Plan 60 days ahead for permits in dense southeast zones.
Leverage Maps and AI Matchers
Begin with Census interactive maps and SF local dashboards to visualize San Francisco neighborhoods by income clusters. Then personalize via SettleSavvy.ai’s AI matchers, inputting budget, family size, and preferences for tailored, stress-free recommendations that simplify your transition.
Conclusion
San Francisco’s neighborhoods reveal stark income disparities, with affluent areas like Pacific Heights boasting median household incomes over $200,000, while Bayview-Hunters Point averages around $60,000. Tech booms, gentrification, and job center proximity drive these divides, profoundly shaping rent prices, school quality, and community vibes. This analysis delivers clear, data-backed insights to demystify the city’s economic landscape.
Now, leverage this knowledge to make informed decisions on housing, relocation, or exploration. Research specific neighborhoods using the referenced data, visit them firsthand, and align your choices with your lifestyle and budget. Embrace San Francisco’s diverse tapestry; your next chapter in the Bay Area starts with understanding its economic heartbeat.