How American Neighborhoods Evolved in the 21st Century
Picture the familiar American suburb at the dawn of the new millennium: rows of identical ranch houses, white picket fences, and cul-de-sacs designed for car-centric living. Now, drive through many of those same areas today. You might encounter vibrant street-level retail, co-working spaces in converted garages, and diverse residents walking to corner cafes. This dramatic shift captures the essence of american neighborhood change in the 21st century.
These transformations did not happen by accident. Economic recessions, technological disruptions, and evolving demographics have rewritten the rules of community design and daily life. The Great Recession of 2008 forced reinvention in foreclosed zones. Ride-sharing apps and remote work eroded the need for sprawling commutes. Meanwhile, millennials and Gen Z prioritize walkability, sustainability, and affordability over isolation.
In this analysis, we dissect the primary drivers of these changes: policy reforms like zoning deregulation, the rise of infill development, and cultural preferences for urban density. Readers will uncover data-backed examples from cities like Austin and Denver, understand the socioeconomic ripple effects, and anticipate future trajectories. By the end, you will grasp how American neighborhoods have adapted, thrived, or struggled, offering lessons for policymakers, homeowners, and urban enthusiasts alike.
Economic Polarization Reshaping Neighborhoods
Economic polarization stands as a defining force in American neighborhood change in the 21st century, with poverty concentration and decline overshadowing rare instances of growth. A landmark study by the University of Minnesota Law School’s Institute on Metropolitan Opportunity (IMO) examined census tracts in the nation’s 50 largest metros from 2000 to 2016, classifying changes into expanding (rising incomes), declining (falling incomes), low-income concentration (poverty influx), low-income displacement (gentrification), and abandonment. This analysis reveals a troubling pattern where low-income concentration emerged as the dominant shift, impacting census tracts home to 36.5 million residents, more than any other category. Notably, the net low-income population in expanding neighborhoods dropped by 464,000, while it ballooned by 5.4 million in declining areas. No metro saw more low-income residents in expanding tracts than declining ones by 2016. These shifts highlight how economic growth often excludes or repels lower-income households, concentrating vulnerability elsewhere. For cross-state movers, grasping this classification equips you to prioritize tracts showing stability or expansion, using tools like census data to filter options early in your search.
Rarity of Neighborhood Growth
True neighborhood prosperity proved exceptionally scarce during this period. Most areas, particularly low- and moderate-income ones, endured economic decline or poverty concentration rather than income gains or gentrification. The IMO report underscores that tens of millions more residents faced these adverse changes than benefited from revival. Racial dynamics amplified the divide: white populations grew 44% in expanding areas but declined 22% in declining ones, while 35% of Black residents lived in declining tracts versus just 9% in expanding ones. Inner-ring suburbs from the 1950s and 1960s bore much of this burden, with rising poverty and diversity. This rarity of growth means movers must scrutinize long-term trends; for instance, check EIG’s Neighborhood Poverty Project for tracts avoiding high-poverty entry since 1980, streamlining your selection of resilient communities.
Rising Rents Exacerbate Affordability Challenges
Soaring housing costs compound these polarization effects. Median gross rents, including utilities, surged from $728 in 2005 to $1,487 in 2024, according to U.S. Census American Community Survey data, more than doubling and far outstripping wage growth. Families now allocate over 30% of income to rent in many areas, with low-income households trapped in declining neighborhoods facing acute unaffordability. This trend displaces renters from growing zones while pricing others out of stagnant ones. Cross-state movers can mitigate this by modeling rent trajectories against income medians via ACS tools, targeting metros where rents rose slower, like select Midwest cities.
Hyper-Localized Revival in Coastal Urban Cores
Revitalization remained confined to hyper-localized pockets, primarily urban cores in coastal metros such as Washington, D.C., Los Angeles, and San Francisco. These areas saw low-income displacement through gentrification, drawing affluent residents to downtowns while broader metro peripheries stagnated. For example, D.C.’s historically Black neighborhoods underwent rapid change, per metro-specific IMO maps, but suburbs absorbed poverty. Explore detailed tract maps in the IMO American Neighborhood Change report to visualize this. Meanwhile, the NCRC analysis notes gentrification affected only 9.8% of eligible tracts from 2013 to 2017. Movers benefit by avoiding hype around “hot” cores; instead, seek balanced suburbs with integration gains, up from 24% in 2000 to 34% in 2020, ensuring long-term value and ease in relocation.
Racial and Demographic Transformations
These racial and demographic transformations have profoundly shaped American neighborhood change in the 21st century, amplifying the economic polarization discussed earlier. Research from the University of Minnesota Law School’s Institute on Metropolitan Opportunity, analyzing Census data from 2000 to 2016, reveals stark racial disparities in neighborhood trajectories. Notably, 35% of Black residents resided in economically declining neighborhoods by 2016, compared to just 9% in expanding ones where population and income grew. In contrast, white populations surged 44% in those expanding areas but plummeted 22% in declining tracts, underscoring patterns of selective migration and persistent segregation. Low-income populations overall shrank by 464,000 in expanding neighborhoods while ballooning by 5.4 million in declining ones, trapping many communities of color in cycles of disinvestment. For cross-state movers, recognizing these divides is crucial; prioritizing expanding areas can secure access to rising opportunities and property values.
Rise of Integrated Neighborhoods
A 2024 Urban Affairs Review study documents meaningful progress in integration, with the share of integrated metropolitan neighborhoods, defined as having at least 20% Black and Hispanic/Latino residents alongside poverty below 40% of regional medians, climbing from 24% in 2000 to 34% in 2020. These neighborhoods demonstrate exceptional stability, as 80% integrated in 2000 remained so by 2010, and 89% from 2010 to 2020. Transitions overwhelmingly trended positive, with 74% of changing areas moving toward greater integration. Yet, 63% of neighborhoods stayed segregated, often as high-income white enclaves or low-income Black areas. This stability signals long-term viability for movers seeking diverse, resilient communities less prone to rapid turnover.
Suburban Diversification Trends
Suburbs epitomize broadening diversity, with people of color rising from 20% of suburban populations in 1990 to 45% by 2020, per Brookings Institution analysis of Census data. All suburban growth from 2010 to 2020 stemmed from nonwhite groups: Latinos added 5.7 million, Asians 3 million, and Blacks 2 million, offsetting white declines. By 2020, suburbs housed majorities of Black (54%), Latino (over 60%), and Asian (over 60%) residents nationwide. Inner-ring suburbs, built in the 1950s-1960s, saw particular poverty and diversity increases, challenging traditional notions of homogeneity.
For cross-state movers, these shifts offer actionable insights: target diversifying suburbs and integrated neighborhoods for stability, as they retain demographic balance and foster social capital. Tools comparing Census metrics on race, income trajectories, and schools simplify this, easing relocation to high-potential areas amid ongoing diversification.
Suburban Shifts: Poverty Rise and Diversity Boom
Inner-ring suburbs, developed en masse during the 1950s and 1960s as symbols of postwar prosperity and middle-class stability, now confront stark challenges that upend their traditional image. These areas, often 5 to 10 miles from urban cores in metros like Baltimore, Philadelphia, and Portland, have experienced disinvestment, aging infrastructure, and surging poverty rates due to capital flight, job losses in manufacturing, and the exodus of higher-income residents to outer rings. Data from the National Community Reinvestment Coalition highlights these zones as epicenters of economic decline, where poverty concentration has grown faster than in cities; by 2019, suburbs housed over 16 million poor residents, surpassing urban totals. This shift, part of broader American neighborhood change in the 21st century, erodes property values and strains local services, contrasting sharply with the idyllic, homogeneous vision of suburban life. For cross-state movers, recognizing these patterns is crucial: prioritize suburbs with recent infrastructure investments or revitalization plans to avoid hidden costs in maintenance or declining amenities.
Suburbs have also emerged as diversity powerhouses, outpacing the U.S. average according to Brookings Institution analysis. By 2020, populations of color in large metro suburbs reached about 45 percent, up from 20 percent in 1990, fueled by immigration, Latino and Asian growth, and Black suburbanization; Black residents now comprise 54 percent of the metro Black population living in suburbs. This demographic boom, detailed in Brookings’ 2020 Census portrait, transforms once-monocultural enclaves into vibrant mosaics, particularly in inner-ring and coastal areas around New York and Los Angeles. Demographer William Frey describes this as the “new suburban reality,” where minorities drive nearly all population gains. Movers benefit by targeting these diverse suburbs for cultural richness and economic vitality, using census data tools to filter for balanced demographics that signal long-term stability.
The classic white flight of the mid-20th century has reversed, with whites contributing just 9 percent of suburban growth in major metros from 2000 to 2010, while populations of color propelled 78 to 100 percent of expansions. This influx impacts school quality and community dynamics profoundly: suburban schools saw students of color rise over 10 percent in 56 percent of majority-white districts from 2000 to 2020, with white enrollment dropping from 55 percent in 2011 to 46 percent in 2022. Yet segregation lingers, straining resources and sparking equity debates, as noted in studies from UCLA and the University of Kansas. Communities experience cultural enrichment alongside tensions over integration. Cross-state movers should review school diversity indexes and local equity initiatives via platforms like GreatSchools.org to select neighborhoods fostering inclusive dynamics.
Suburban densification accelerates these changes, evidenced by a 77 percent surge in multifamily units in structures of 50 or more, reaching 10.2 million nationwide from 2005 to 2024 per U.S. Census data. This boom, peaking with 608,000 completions in 2024, responds to affordability crises and zoning reforms, shifting growth from rural exurbs to accessible suburbs. It offers renters and young families more options amid median gross rents climbing from $728 to $1,487. For interstate relocators, this signals opportunity: scout multifamily-heavy suburbs for lower entry barriers, using Census ACS maps to identify up-and-coming areas that ease the moving process with abundant housing stock and transit proximity. These trends underscore suburbs as adaptive frontiers in American neighborhood evolution.
Gentrification: Scale, Patterns, and Displacement
Gentrification emerges as a pivotal yet limited dynamic within American neighborhood change in the 21st century, building on the economic polarization, racial shifts, and suburban transformations previously outlined. This process involves the influx of higher-income residents into low-income urban areas, driving up property values and investments, but it often results in demographic upheaval rather than widespread prosperity. Data from the National Community Reinvestment Coalition (NCRC) reveals its rarity: between 2013 and 2017, only 9.8% of eligible low-income neighborhoods, defined as those in the bottom 40th percentile for income and home values, experienced gentrification. These changes were hyper-localized, affecting just 954 out of 9,743 tracts across 20 metro areas. Over the longer arc from 1970 to 2020, the scale expanded from 246 gentrifying tracts in the 1970s to 1,807 in the 2010s, yet this still represents about 15% of urban neighborhoods nationwide, per NCRC’s comprehensive analysis.
Patterns in Majority-Black Neighborhoods: Racial Turnover and Displacement
Gentrification has disproportionately targeted majority-Black neighborhoods, accelerating displacement amid broader 21st-century demographic trends. According to the NCRC’s Displaced by Design report, 523 such tracts gentrified between 1980 and 2020, with 155 undergoing full racial turnovers to majority non-Hispanic White or Hispanic compositions. This shift led to a net loss of 261,000 Black residents, a figure that underscores indirect displacement through soaring rents and taxes rather than mass evictions. In Washington, D.C., for instance, 61,000 Black residents departed gentrifying areas, replaced by 54,000 non-Hispanic Whites, eroding historic Black cultural enclaves like U Street. Similar patterns struck New York City, Philadelphia, and Atlanta, where pre-gentrification population declines often preceded racial transitions, with White, Asian, and Hispanic inflows replacing Black shares. These dynamics highlight how gentrification amplifies the racial disparities noted in earlier neighborhood analyses.
Debunking Myths: Rarity and Displacement Over Uplift
Contrary to popular narratives of ubiquitous urban revival, gentrification remains uncommon over five decades, covering roughly 15% of urban tracts while poverty concentration impacts 36.5 million residents, as detailed in University of Minnesota studies from 2000 to 2016. Most neighborhoods face decline or stagnation, not growth, with low-income populations gaining 5.4 million in declining areas versus a 464,000 loss in expanding ones. Where it occurs, benefits rarely uplift incumbents; instead, rent hikes of 20-50% in hotspots like Denver and Nashville price out families, converting affordable units to luxury stock. NCRC experts emphasize this displacement focus, noting cultural commodification, such as breweries supplanting Black churches, without broad economic gains for original residents.
For cross-state movers prioritizing family stability, identifying at-risk areas is straightforward using public trend data. Cross-reference Census tract tools like the NCRC interactive map or Longitudinal Tract Database for surges in median income, home values exceeding 60th percentile gains, or Black population drops over 5%. Red flags include 10%+ annual home price growth in low-income tracts or White/Asian influxes two standard deviations above norms, especially in high-risk metros like D.C. or Austin. Favor stable zones with community reinvestment lending, rent controls, or minimal displacement projections under 5%. Practical steps involve querying 2020-2025 American Community Survey estimates via ACS tools, filtering Zillow trends for 3-5 year price velocity, and seeking inclusionary zoning protections. This data-driven approach simplifies selecting enduring neighborhoods, safeguarding long-term value amid 21st-century flux.
Post-2020 Trends: Remote Work and Migration
The COVID-19 pandemic supercharged American neighborhood change in the 21st century, accelerating shifts that built upon decades of economic polarization, suburban diversification, and limited gentrification. Remote work, surging from 6.5% of the workforce in 2019 to over 20% by 2021, untethered millions from urban cores, fueling net population gains in suburbs, rural areas, and smaller metros. Non-metro counties flipped from net outflows of 16,000 in 2019-2020 to annual inflows of around 200,000 post-2021, while lower-density suburbs saw 60% higher net migration. By late 2025, nearly 1 in 5 homebuyers (18.8%) sought homes outside their metro areas, up from 15.9% five years prior, according to Harvard Joint Center for Housing Studies (JCHS). This trend is evolving into 2026, with demand pivoting toward mid-sized cities like Indianapolis, Columbus, Sacramento, and Boise, offering space, affordability, and lifestyle perks over coastal megacities.
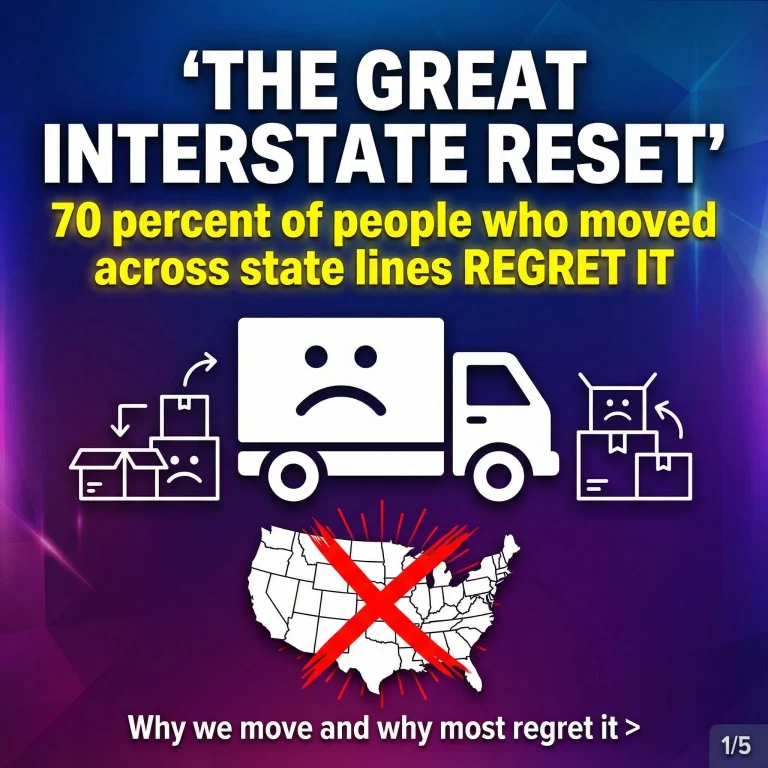
Interstate migration hit a 10-year low in 2024, with only 7.15 million Americans (2.1% of the population) crossing state lines, down 13% from 2022 peaks, per StorageCafe analysis. High mortgage rates and home prices created “lock-in” effects, slashing overall household mobility to 8.3%. Yet, Midwest metros bucked the slowdown; Indianapolis added over 22,000 residents from 2024-2025, ranking first nationally for domestic inflows, while Indiana’s net migration doubled to 12,197. Sunbelt hotspots like Florida and Texas saw inflows ease, with Florida dropping from 238,000 in 2022 to 137,000 in 2023 amid rising costs.
Bank of America Institute pinpoints affordability, job opportunities, and family ties as primary drivers, with movers favoring familiar regions for cost savings and stability. Climate considerations and data center booms further boost Midwest and select Sunbelt areas. For cross-state movers, these factors simplify decisions: prioritize metros with strong remote job markets and lower costs to ease the transition.
These dynamics are redrawing housing maps, straining supplies in gaining mid-sized cities while cooling high-cost metros like New York and Los Angeles. Rural “zoom towns” saw home prices rise 36% faster than urban areas through 2025, per MPA Magazine analysis. Cross-state movers gain flexibility by targeting these shifts; tools comparing affordability, schools, and remote compatibility streamline neighborhood selection, minimizing relocation stress and maximizing long-term value. As migration stabilizes, proactive planning positions families for thriving in evolving landscapes.
Emerging Forces: Climate and Housing Dynamics
Building on the post-2020 migration trends and suburban shifts previously examined, climate change now emerges as a transformative force in American neighborhood change in the 21st century. Prolonged Midwest droughts and intensifying Southern floods are driving population outflows from vulnerable areas, exacerbating uneven neighborhood transformations. These climate pressures accelerate poverty concentration in declining rural and coastal zones while fueling rapid growth in resilient destinations. For instance, the Ogallala Aquifer’s depletion in Nebraska, Kansas, and Oklahoma threatens agricultural viability, with towns like Ordway, Colorado, experiencing halved school enrollments and shuttered businesses due to water shortages and failed crops. Meanwhile, Southern hurricanes and sea-level rise, such as those eroding Louisiana’s Isle de Jean Charles, displace communities inland, leaving behind “ghost neighborhoods” akin to Dust Bowl legacies. This migration pattern intensifies disinvestment in high-risk origins and strains housing in safer inflows, as detailed in a ProPublica report on climate-driven U.S. migration.
These flows intersect with a multifamily housing boom and suburban super-gentrification, reshaping neighborhood dynamics further. Multifamily units in structures of 50 or more have surged 77% to 10.2 million since 2005, driven by urbanizing demand in receiving suburbs, yet restrictive zoning on 75% of city land limits supply. Influxes to climate-resilient suburbs spark super-gentrification, where affluent movers bid up prices, displacing low-income and minority residents; post-2018 Camp Fire Chico, California, saw 21% home price spikes and renter evictions. Buffalo, New York, exemplifies this, with investor purchases amid national rent hikes, echoing limited urban gentrification but now suburban-scaled. Such pressures widen affordability gaps, with median gross rents doubling to $1,487 by 2024.
Projections for 2026-2030, grounded in 2024-2026 data, signal northward acceleration. Midwest cities like Indianapolis and Columbus led Q4 2025 inflows, while Florida’s net migration plummeted 80% from 2022 peaks. Resilience concerns dominate, with 83% of buyers factoring climate risks and insurance costs up 24%; Florida averages $5,838 annually for a $300,000 home. Affordability strains persist, as 50% of households face cost burdens, but Midwest medians at $317,000 offer relief versus Western $626,000 levels, per Bank of America migration analysis.
For cross-state movers, predictive analysis is essential to sidestep high-risk zones and streamline relocation. Prioritize “climate havens” like Great Lakes hubs (Buffalo, Milwaukee, Duluth) for freshwater access and low disaster indices under 100, or Northeast states (Vermont, New Hampshire). Avoid Florida (58% risk perception), Gulf Texas, and Southwest heat corridors. Actionable steps include consulting FEMA flood maps, targeting suburbs with zoning reforms for multifamily, and investing in resilient features costing $20,000 to $150,000. This foresight not only mitigates future costs but identifies value-stable neighborhoods, easing the moving process amid these dynamics.
Implications for Cross-State Movers
Cross-state movers navigating American neighborhood change in the 21st century must balance entrenched risks with emerging opportunities to secure stable, long-term homes. Building on patterns of economic polarization, suburban diversification, and limited gentrification, poverty concentration remains the dominant threat, affecting 36.5 million residents in low-income tracts from 2000 to 2016, with low-income populations surging by 5.4 million in declining areas while dropping 464,000 in expanding ones. Gentrification, though rarer, displaces communities in core cities like Washington, D.C., and Los Angeles, where 523 majority-Black tracts saw full racial turnover since 1980, leading to 261,000 fewer Black residents. These dynamics trap newcomers in disinvested inner-ring suburbs or expose them to future displacement amid rising rents, which climbed from $728 median gross in 2005 to $1,487 in 2024. Conversely, stable, diversifying suburbs offer refuge, now housing 45% people of color per 2020 Census data, with POC populations growing by 13.15 million from 2010 to 2020 as white flight reversed. Today’s suburbs are symbolic of America’s rising diversity, providing access to better schools, safety, and growth for proactive movers.
Essential Metrics for Neighborhood Evaluation
To mitigate risks, evaluate neighborhoods using precise metrics tied to 21st-century trends. Track low-income shifts via Census ACS data; prioritize areas with declining poverty rates below 20% growth, avoiding tracts where 35% of Black residents cluster in declining zones. Assess racial integration, which rose from 24% to 34% of neighborhoods between 2000 and 2020, favoring diverse suburbs with high multiracial shares for social capital and equity. Monitor migration inflows through IRS and Census reports, targeting positive net domestic gains in mid-sized metros like Indianapolis or Columbus, where post-COVID remote work drives affordability-focused moves. For instance, suburbs with steady POC inflows, such as those in Atlanta or Dallas, signal stability over urban volatility. These actionable benchmarks empower movers to forecast fit amid interstate trends at a 10-year low.
Harnessing AI for Future Simulations
AI tools like SettleSavvy.ai streamline this process by simulating neighborhood trajectories based on historical patterns. Users input preferences for schools, safety, and growth; the platform matches against data on poverty shifts, integration, and inflows, projecting 5-10 year changes in minutes. Drawing from 21st-century evidence like suburban diversification and climate-driven migrations, it flags rising areas pre-gentrification while vetting real estate agents. This reduces guesswork for cross-state relocations, especially with Sunbelt slowdowns favoring Midwest gains.
Data-driven decisions add immense value, simplifying the moving process and ensuring enduring alignment. By sidestepping poverty traps and displacement, movers achieve equity and stability, turning complex trends into confident choices.
Actionable Takeaways for Your Next Move
As cross-state movers confront the realities of American neighborhood change in the 21st century, prioritizing expanding or stable neighborhoods over declining ones proves essential for long-term security. Cross-reference Institute on Metropolitan Opportunity (IMO) classifications from their 2000-2016 analysis with recent U.S. Census data to identify winners: expanding areas saw a net loss of 464,000 low-income residents, while declining tracts absorbed 5.4 million, trapping 36.5 million in concentrated poverty. For instance, vibrant Sunbelt metros like those around Indianapolis show stability via Census American Community Survey trends, contrasting with inner-ring suburbs where poverty rose amid white flight. Action step: Filter searches for IMO “expanding” or low-poverty stable zones, verifying with 2024 Census rent hikes from $728 median in 2005 to $1,487 today to ensure affordability holds.
Mitigating Gentrification While Embracing Diversity
Urban targets demand scrutiny for gentrification risk, as only 9.8 percent of eligible low-income neighborhoods transformed between 2013 and 2017, yet 523 majority-Black tracts experienced full racial turnover since 1980, displacing thousands. Favor integrated suburbs where diversity surged, with shared neighborhoods rising from 24 percent in 2000 to 34 percent in 2020; these areas blend stability with opportunity. Examples include diverse exurbs near Columbus, Ohio, outperforming hyper-localized coastal gentrification in cities like San Francisco. Assess via demographic overlays, targeting suburbs now more diverse than the national average at 45 percent people of color.
Future-Proofing with Emerging Trends
Incorporate post-2026 projections: remote work’s suburban pull wanes as 1 in 5 buyers eye mid-sized cities, per 2025 trends, while climate resilience counters Midwest droughts and Southern floods driving migration. Prioritize areas with high-speed internet infrastructure and low flood-risk scores from Census climate data.
Streamline with Expert Tools and Vigilance
Leverage SettleSavvy.ai for personalized neighborhood forecasts, affordability comparisons, and change trajectory maps, simplifying cross-state decisions amid interstate moves at a 10-year low. Track annual Census migration reports and local data dashboards for real-time insights, safeguarding family security in an era of polarization and flux. This proactive approach transforms complexity into confidence.
Conclusion
American neighborhoods have undergone profound evolution in the 21st century, driven by key forces. First, the Great Recession catalyzed reinvention in foreclosed areas through adaptive reuse. Second, technologies like ride-sharing and remote work diminished car dependency, fostering walkable designs. Third, millennials and Gen Z prioritize sustainability, diversity, and affordability over isolation. Fourth, policy shifts such as zoning deregulation unlocked vibrant, mixed-use spaces.
This analysis equips you with insights to understand these changes and their implications for daily life. Now, take action: evaluate your own neighborhood’s potential, advocate for progressive policies, or join community efforts to enhance walkability.
The future holds connected, resilient communities. Embrace the momentum and shape tomorrow’s neighborhoods today.


6 Comments